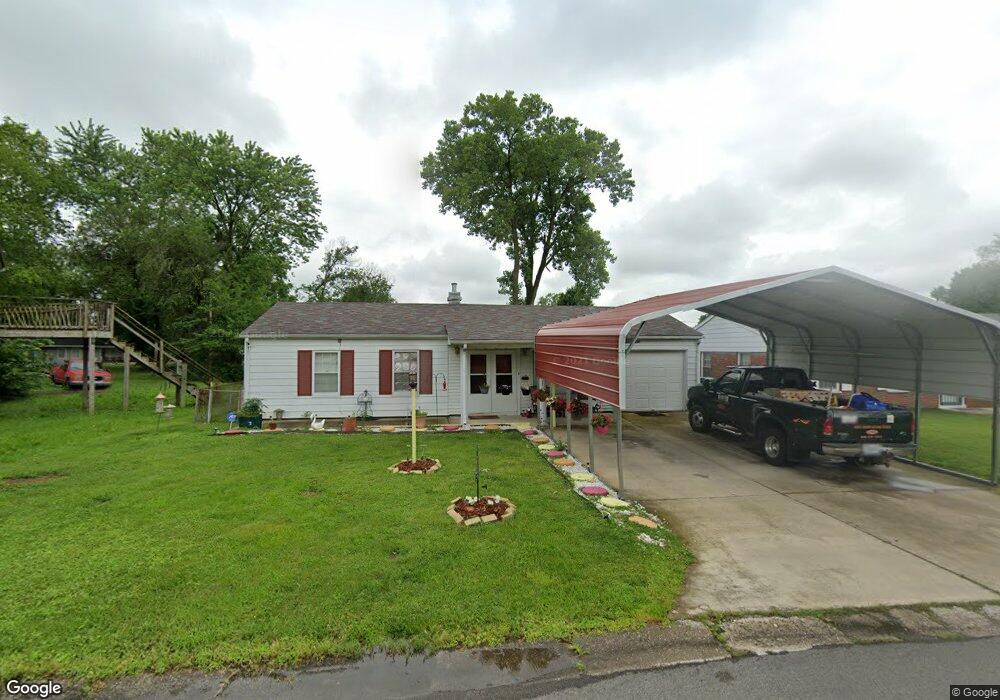
4924 Piggott Ave East Saint Louis, IL 62207
Estimated Value: $34,000 - $92,000
4
Beds
2
Baths
1,213
Sq Ft
$51/Sq Ft
Est. Value
About This Home
This home is located at 4924 Piggott Ave, East Saint Louis, IL 62207 and is currently estimated at $61,981, approximately $51 per square foot. 4924 Piggott Ave is a home located in St. Clair County with nearby schools including Katie Harper-Wright Elementary School, Mason/Clark Middle School, and East St Louis Senior High School.
Ownership History
Date
Name
Owned For
Owner Type
Purchase Details
Closed on
Apr 16, 2009
Sold by
Jp Morgan Chase Bank
Bought by
Sanders Earvin and Sanders Marie
Current Estimated Value
Purchase Details
Closed on
Feb 11, 2009
Sold by
Gibson Charlie
Bought by
Jp Morgan Chase Bank
Purchase Details
Closed on
Aug 22, 2001
Sold by
Gibson Erin G
Bought by
Gibson Erin G and Gibson Charlie
Home Financials for this Owner
Home Financials are based on the most recent Mortgage that was taken out on this home.
Original Mortgage
$45,565
Interest Rate
7.11%
Create a Home Valuation Report for This Property
The Home Valuation Report is an in-depth analysis detailing your home's value as well as a comparison with similar homes in the area
Home Values in the Area
Average Home Value in this Area
Purchase History
| Date | Buyer | Sale Price | Title Company |
|---|---|---|---|
| Sanders Earvin | $10,000 | Chicago Title | |
| Jp Morgan Chase Bank | -- | None Available | |
| Gibson Erin G | -- | Nations Title Agency Inc |
Source: Public Records
Mortgage History
| Date | Status | Borrower | Loan Amount |
|---|---|---|---|
| Previous Owner | Gibson Erin G | $45,565 |
Source: Public Records
Tax History Compared to Growth
Tax History
| Year | Tax Paid | Tax Assessment Tax Assessment Total Assessment is a certain percentage of the fair market value that is determined by local assessors to be the total taxable value of land and additions on the property. | Land | Improvement |
|---|---|---|---|---|
| 2024 | $215 | $12,339 | $611 | $11,728 |
| 2023 | $140 | $11,152 | $552 | $10,600 |
| 2022 | $149 | $9,774 | $484 | $9,290 |
| 2021 | $157 | $9,262 | $459 | $8,803 |
| 2020 | $157 | $9,223 | $481 | $8,742 |
| 2019 | $162 | $9,223 | $481 | $8,742 |
| 2018 | $165 | $9,358 | $488 | $8,870 |
| 2017 | $165 | $9,132 | $476 | $8,656 |
| 2016 | $1,342 | $6,572 | $475 | $6,097 |
| 2014 | $1,187 | $6,501 | $470 | $6,031 |
| 2013 | $300 | $6,098 | $441 | $5,657 |
Source: Public Records
Map
Nearby Homes