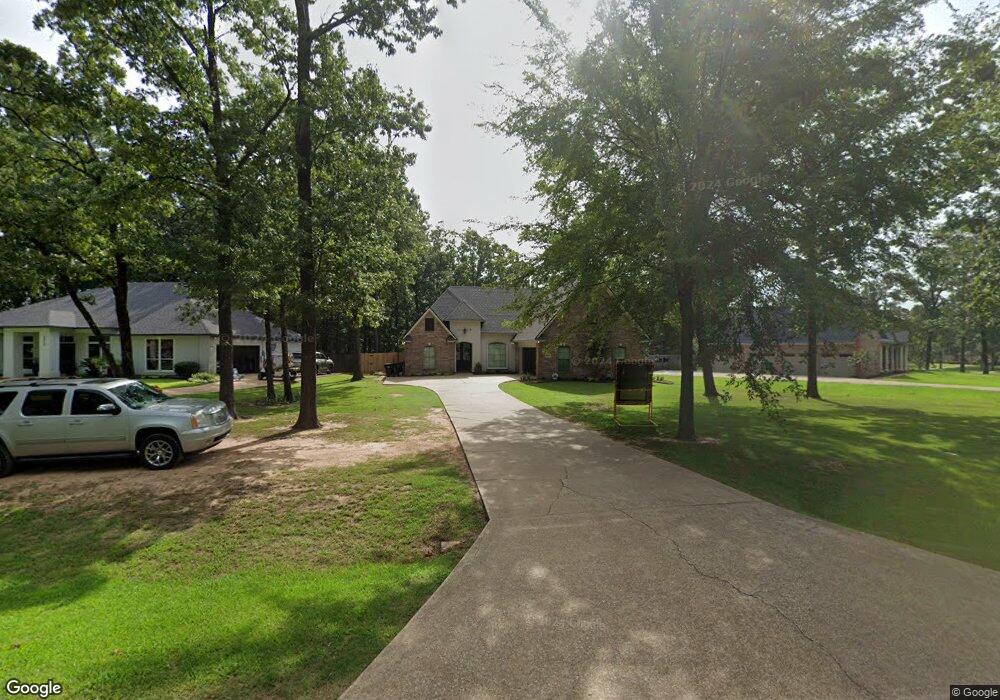
4924 Willow Chase Dr Benton, LA 71006
Dukedale-Vanceville NeighborhoodEstimated Value: $384,500 - $460,000
3
Beds
3
Baths
2,280
Sq Ft
$187/Sq Ft
Est. Value
About This Home
This home is located at 4924 Willow Chase Dr, Benton, LA 71006 and is currently estimated at $426,375, approximately $187 per square foot. 4924 Willow Chase Dr is a home located in Bossier Parish with nearby schools including Legacy Elementary School, Benton Middle School, and Benton High School.
Ownership History
Date
Name
Owned For
Owner Type
Purchase Details
Closed on
May 20, 2013
Sold by
Dodson Daniel Mathew and Dodson January K
Bought by
Garrison Andrew Carroll and Garrison Misty May
Current Estimated Value
Home Financials for this Owner
Home Financials are based on the most recent Mortgage that was taken out on this home.
Original Mortgage
$275,250
Outstanding Balance
$195,744
Interest Rate
3.56%
Mortgage Type
Unknown
Estimated Equity
$230,631
Purchase Details
Closed on
Jan 15, 2008
Sold by
Terry A Mccall Inc
Bought by
Dodson Daniel Matthew and Dodson January K
Home Financials for this Owner
Home Financials are based on the most recent Mortgage that was taken out on this home.
Original Mortgage
$191,300
Interest Rate
5.94%
Mortgage Type
New Conventional
Purchase Details
Closed on
Oct 12, 2007
Sold by
Black Bayou Partners Ltd
Bought by
Terry A Mccall Inc
Create a Home Valuation Report for This Property
The Home Valuation Report is an in-depth analysis detailing your home's value as well as a comparison with similar homes in the area
Home Values in the Area
Average Home Value in this Area
Purchase History
| Date | Buyer | Sale Price | Title Company |
|---|---|---|---|
| Garrison Andrew Carroll | $289,900 | None Available | |
| Dodson Daniel Matthew | -- | None Available | |
| Terry A Mccall Inc | -- | None Available |
Source: Public Records
Mortgage History
| Date | Status | Borrower | Loan Amount |
|---|---|---|---|
| Open | Garrison Andrew Carroll | $275,250 | |
| Previous Owner | Dodson Daniel Matthew | $191,300 |
Source: Public Records
Tax History
| Year | Tax Paid | Tax Assessment Tax Assessment Total Assessment is a certain percentage of the fair market value that is determined by local assessors to be the total taxable value of land and additions on the property. | Land | Improvement |
|---|---|---|---|---|
| 2024 | $2,947 | $31,815 | $4,000 | $27,815 |
| 2023 | $2,460 | $26,593 | $3,500 | $23,093 |
| 2022 | $2,447 | $26,593 | $3,500 | $23,093 |
| 2021 | $2,409 | $26,593 | $3,500 | $23,093 |
| 2020 | $2,409 | $26,593 | $3,500 | $23,093 |
| 2019 | $2,429 | $26,520 | $3,400 | $23,120 |
| 2018 | $2,429 | $26,520 | $3,400 | $23,120 |
| 2017 | $2,401 | $26,520 | $3,400 | $23,120 |
| 2016 | $2,401 | $26,520 | $3,400 | $23,120 |
| 2015 | $2,276 | $26,600 | $3,400 | $23,200 |
| 2014 | $2,273 | $26,600 | $3,400 | $23,200 |
Source: Public Records
Map
Nearby Homes
- 277 Old Palmetto Rd
- 4101 Lakeway Cir
- 103 S Parkridge Dr
- 4618 Palmetto Rd
- 213 Roanoke Cir
- 323 Newport Ln
- 113 Park Blvd
- 307 Newport Ln
- 251 Jessie Jones Dr
- 4425 Ellis Ct
- 1140 Linton Rd
- 3909 Le Brooke Ln
- 1104 Long Key Cir
- 501 Hempstead Cir
- 4016 Elizabeth Ln
- 107 Spy Glass Hill Dr
- 1310 Bay Ridge Dr
- 0 Linton Rd Unit 21192425
- 120 Preston Bay Cir
- 1210 Big Pine Key Ln
- 4928 Willow Chase Dr
- 4920 Willow Chase Dr
- 4002 Wisteria Ln
- 4820 Carolyn Cir
- 4923 Willow Chase Dr
- 4934 Willow Chase Dr
- 4921 Willow Chase Dr
- 4925 Willow Chase Dr
- 4006 Wisteria Ln
- 4919 Willow Chase Dr
- 4929 Willow Chase Dr
- 4936 Willow Chase Dr
- 4818 Carolyn Cir
- 4917 Willow Chase Dr
- 4010 Wisteria Ln
- 4819 Carolyn Cir
- 4931 Willow Chase Dr
- 4938 Willow Chase Dr
- 4933 Willow Chase Dr
- 239 Old Palmetto Rd
Your Personal Tour Guide
Ask me questions while you tour the home.