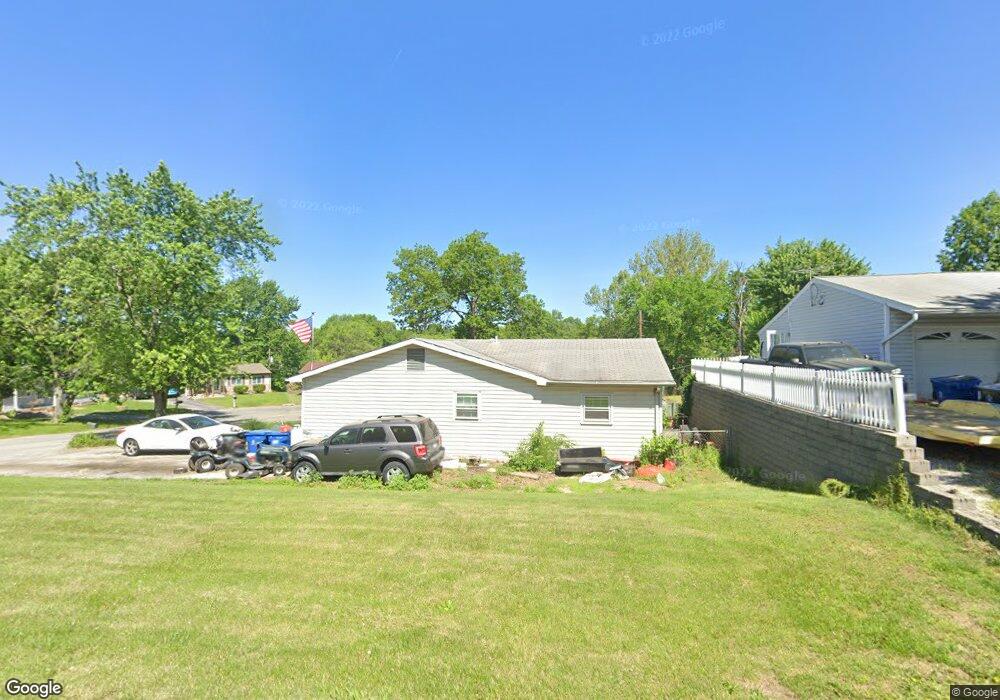
4925 Cherry Blossom Ln Hazelwood, MO 63042
Estimated Value: $150,000 - $201,000
3
Beds
1
Bath
1,236
Sq Ft
$145/Sq Ft
Est. Value
About This Home
This home is located at 4925 Cherry Blossom Ln, Hazelwood, MO 63042 and is currently estimated at $178,811, approximately $144 per square foot. 4925 Cherry Blossom Ln is a home located in St. Louis County with nearby schools including Garrett Elementary School, West Middle School, and Hazelwood West High School.
Ownership History
Date
Name
Owned For
Owner Type
Purchase Details
Closed on
Feb 27, 2020
Sold by
U S Bank Trust National Association
Bought by
Nyland Gretchen M
Current Estimated Value
Home Financials for this Owner
Home Financials are based on the most recent Mortgage that was taken out on this home.
Original Mortgage
$76,000
Outstanding Balance
$67,293
Interest Rate
3.6%
Mortgage Type
New Conventional
Estimated Equity
$111,518
Purchase Details
Closed on
Aug 13, 2019
Sold by
Augutine Elizabeth A and Augustine Elmer V
Bought by
Us Bank Trust National Association and Lodge Series Iii Trust
Purchase Details
Closed on
Oct 29, 1998
Sold by
Skurat Elizabeth A and Skurat Elmer V
Bought by
Augustine Elmer and Augustine Elizabeth A
Home Financials for this Owner
Home Financials are based on the most recent Mortgage that was taken out on this home.
Original Mortgage
$64,000
Interest Rate
6.57%
Create a Home Valuation Report for This Property
The Home Valuation Report is an in-depth analysis detailing your home's value as well as a comparison with similar homes in the area
Home Values in the Area
Average Home Value in this Area
Purchase History
| Date | Buyer | Sale Price | Title Company |
|---|---|---|---|
| Nyland Gretchen M | $80,000 | Us Title Mehlville | |
| Us Bank Trust National Association | $69,995 | None Available | |
| Augustine Elmer | -- | Nations Title Agency Inc |
Source: Public Records
Mortgage History
| Date | Status | Borrower | Loan Amount |
|---|---|---|---|
| Open | Nyland Gretchen M | $76,000 | |
| Previous Owner | Augustine Elmer | $64,000 |
Source: Public Records
Tax History Compared to Growth
Tax History
| Year | Tax Paid | Tax Assessment Tax Assessment Total Assessment is a certain percentage of the fair market value that is determined by local assessors to be the total taxable value of land and additions on the property. | Land | Improvement |
|---|---|---|---|---|
| 2025 | $2,427 | $32,930 | $7,560 | $25,370 |
| 2024 | $2,427 | $30,040 | $3,020 | $27,020 |
| 2023 | $2,461 | $30,040 | $3,020 | $27,020 |
| 2022 | $2,132 | $23,240 | $5,890 | $17,350 |
| 2021 | $2,096 | $23,240 | $5,890 | $17,350 |
| 2020 | $1,898 | $19,680 | $3,360 | $16,320 |
| 2019 | $1,871 | $19,680 | $3,360 | $16,320 |
| 2018 | $1,725 | $16,800 | $3,290 | $13,510 |
| 2017 | $1,713 | $16,800 | $3,290 | $13,510 |
| 2016 | $1,512 | $14,710 | $2,530 | $12,180 |
| 2015 | $1,452 | $14,710 | $2,530 | $12,180 |
| 2014 | $1,280 | $12,900 | $3,170 | $9,730 |
Source: Public Records
Map
Nearby Homes
- 12600 Missouri Bottom Rd
- 5156 Carey Ln
- 1748 Spring Forest Ln
- 4921 Tulip Tree Ln
- 1572 Ville Rosa Ln
- 12 Ville Donna Ct
- 1496 Ville Rosa Ln
- 5365 Ville Rosa Ln
- 1514 Laurel Bluffs Dr
- 1327 Eagles Way Ct
- 1307 Eagles Way Ct
- 6746 Barnwood Dr
- 1209 Woodcrest Ln
- 4229 Carrollton Dr Unit C
- 4159 Gallatin Ln Unit B
- 4115 Scotch Dr
- 1227 Teson Rd
- 12 Robinwing Ln
- 420 Chapel Ridge Dr Unit 11B
- 1101 Nathaniel Ct
- 4929 Cherry Blossom Ln
- 4923 Cherry Blossom Ct
- 4933 Cherry Blossom Ln
- 1716 Leafcrest Dr
- 4924 Cherry Blossom Ln
- 4928 Cherry Blossom Ln
- 4920 Cherry Blossom Ln
- 4921 Cherry Blossom Ct
- 4932 Cherry Blossom Ln
- 1718 Leafcrest Dr
- 4915 Cherry Blossom Ct
- 4919 Cherry Blossom Ct
- 4916 Cherry Blossom Ln
- 4917 Cherry Blossom Ct
- 4936 Cherry Blossom Ln
- 1720 Leafcrest Dr
- 4909 Cherry Blossom Ln
- 1710 Leafcrest Dr
- 4912 Cherry Blossom Ln
- 4918 Rose Blossom Ln