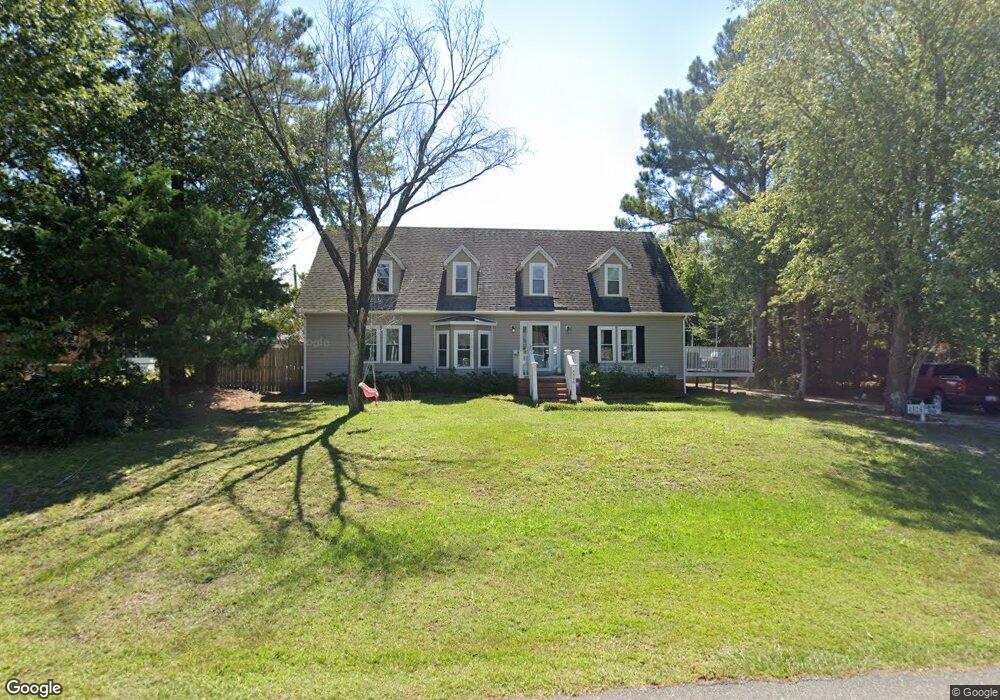
4926 Cantwell Rd Unit 200 Wilmington, NC 28411
Estimated Value: $423,000 - $488,000
5
Beds
3
Baths
2,447
Sq Ft
$188/Sq Ft
Est. Value
About This Home
This home is located at 4926 Cantwell Rd Unit 200, Wilmington, NC 28411 and is currently estimated at $460,151, approximately $188 per square foot. 4926 Cantwell Rd Unit 200 is a home located in New Hanover County with nearby schools including John J. Blair Elementary School, Emma B. Trask Middle School, and Emsley A. Laney High School.
Ownership History
Date
Name
Owned For
Owner Type
Purchase Details
Closed on
Apr 5, 2018
Sold by
Uberous Llc
Bought by
Young Tessa E and Vossler Jeffrey D
Current Estimated Value
Home Financials for this Owner
Home Financials are based on the most recent Mortgage that was taken out on this home.
Original Mortgage
$230,743
Outstanding Balance
$198,839
Interest Rate
4.62%
Mortgage Type
FHA
Estimated Equity
$261,312
Purchase Details
Closed on
Jun 22, 2015
Sold by
Miller Reginald B and Miller Angela Lynne
Bought by
Uberous Llc
Purchase Details
Closed on
Sep 22, 1998
Sold by
Walker Merdis G
Bought by
Miller R Bruce Angela L
Purchase Details
Closed on
Aug 1, 1985
Sold by
Henderson Sherrie J
Bought by
Walker Merdis G
Purchase Details
Closed on
Jan 1, 1982
Sold by
Woodhouse Adolphus C
Bought by
Henderson James G Jr Sher
Purchase Details
Closed on
Jun 1, 1976
Bought by
Woodhouse Adolphus C
Create a Home Valuation Report for This Property
The Home Valuation Report is an in-depth analysis detailing your home's value as well as a comparison with similar homes in the area
Home Values in the Area
Average Home Value in this Area
Purchase History
| Date | Buyer | Sale Price | Title Company |
|---|---|---|---|
| Young Tessa E | $244,000 | None Available | |
| Uberous Llc | $115,102 | None Available | |
| Miller R Bruce Angela L | $18,000 | -- | |
| Walker Merdis G | $7,000 | -- | |
| Henderson James G Jr Sher | -- | -- | |
| Woodhouse Adolphus C | $10,000 | -- |
Source: Public Records
Mortgage History
| Date | Status | Borrower | Loan Amount |
|---|---|---|---|
| Open | Young Tessa E | $230,743 |
Source: Public Records
Tax History Compared to Growth
Tax History
| Year | Tax Paid | Tax Assessment Tax Assessment Total Assessment is a certain percentage of the fair market value that is determined by local assessors to be the total taxable value of land and additions on the property. | Land | Improvement |
|---|---|---|---|---|
| 2025 | $1,698 | $443,100 | $121,000 | $322,100 |
| 2023 | $1,698 | $310,800 | $67,200 | $243,600 |
| 2022 | $1,707 | $310,800 | $67,200 | $243,600 |
| 2021 | $1,714 | $310,800 | $67,200 | $243,600 |
| 2020 | $1,187 | $187,700 | $36,000 | $151,700 |
| 2019 | $1,187 | $187,700 | $36,000 | $151,700 |
| 2018 | $1,187 | $187,700 | $36,000 | $151,700 |
| 2017 | $1,215 | $187,700 | $36,000 | $151,700 |
| 2016 | $1,299 | $187,500 | $36,000 | $151,500 |
| 2015 | $1,208 | $187,500 | $36,000 | $151,500 |
| 2014 | $1,187 | $187,500 | $36,000 | $151,500 |
Source: Public Records
Map
Nearby Homes
- 811 Bay Blossom Dr
- 4829 Gordon Rd
- 4844 Acres Dr
- 6110 Gordon Rd
- 4742 Tupelo Dr
- 1658 Killdeer Ln
- 1508 Dove Shell Way
- 2213 White Rd
- 141 Hargrove Dr
- 2232 White Rd
- 2305 Wildberry Ct
- 1911 Daniel Boone Trail
- 136 Blount Dr
- 6331 Gordon Rd
- 1915 Daniel Boone Trail
- 706 Bent Twig Ct
- 2400 Sunburst Ct
- 2409 White Rd
- 800 Caspian Ct
- 5202 Fitzgerald Dr
- 4926 Cantwell Rd
- 4930 Cantwell Rd
- 4925 Gordon Rd
- 4921 Gordon Rd
- 4918 Cantwell Rd
- 4925 Cantwell Rd
- 4929 Gordon Rd
- 4917 Gordon Rd
- 4929 Cantwell Rd
- 4921 Cantwell Rd
- 4914 Cantwell Rd
- 4917 Cantwell Rd
- 4913 Gordon Rd
- 609 Everbreeze Ln
- 611 Everbreeze Ln
- 607 Everbreeze Ln
- 4910 Cantwell Rd
- 605 Everbreeze Ln
- 4930 Ivanhoe St
- 4909 Gordon Rd