Estimated Value: $183,000 - $194,000
3
Beds
2
Baths
1,366
Sq Ft
$138/Sq Ft
Est. Value
About This Home
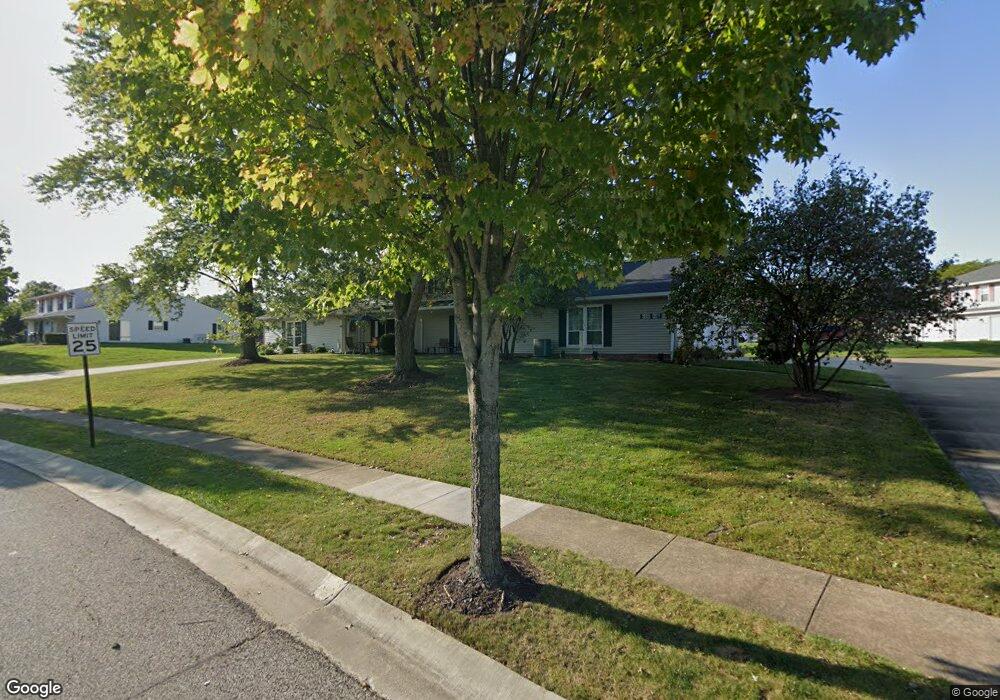
This home is located at 4926 Independence Cir Unit 29A, Stow, OH 44224 and is currently estimated at $188,053, approximately $137 per square foot. 4926 Independence Cir Unit 29A is a home located in Summit County with nearby schools including Stow-Munroe Falls High School, Primrose School of Hudson, and Holy Family Elementary School.
Ownership History
Date
Name
Owned For
Owner Type
Purchase Details
Closed on
Jun 17, 2024
Sold by
Merkle Erich R and Merkle Holly D
Bought by
Mcbride Connor and Keller Brandi
Current Estimated Value
Home Financials for this Owner
Home Financials are based on the most recent Mortgage that was taken out on this home.
Original Mortgage
$148,000
Outstanding Balance
$146,183
Interest Rate
7.22%
Mortgage Type
New Conventional
Estimated Equity
$41,870
Purchase Details
Closed on
Aug 15, 2011
Sold by
Merkle Erich R
Bought by
Merkle Erich R and Merkle Holly D
Purchase Details
Closed on
Aug 8, 2005
Sold by
Poston David W and Poston Patricia A
Bought by
Merkle Erich R
Home Financials for this Owner
Home Financials are based on the most recent Mortgage that was taken out on this home.
Original Mortgage
$108,100
Interest Rate
5.93%
Mortgage Type
Fannie Mae Freddie Mac
Create a Home Valuation Report for This Property
The Home Valuation Report is an in-depth analysis detailing your home's value as well as a comparison with similar homes in the area
Home Values in the Area
Average Home Value in this Area
Purchase History
| Date | Buyer | Sale Price | Title Company |
|---|---|---|---|
| Mcbride Connor | $185,000 | None Listed On Document | |
| Merkle Erich R | -- | Attorney | |
| Merkle Erich R | $111,500 | Miller Examining Service Inc |
Source: Public Records
Mortgage History
| Date | Status | Borrower | Loan Amount |
|---|---|---|---|
| Open | Mcbride Connor | $148,000 | |
| Previous Owner | Merkle Erich R | $108,100 |
Source: Public Records
Tax History Compared to Growth
Tax History
| Year | Tax Paid | Tax Assessment Tax Assessment Total Assessment is a certain percentage of the fair market value that is determined by local assessors to be the total taxable value of land and additions on the property. | Land | Improvement |
|---|---|---|---|---|
| 2025 | $2,855 | $50,166 | $5,075 | $45,091 |
| 2024 | $2,855 | $50,166 | $5,075 | $45,091 |
| 2023 | $2,855 | $50,166 | $5,075 | $45,091 |
| 2022 | $2,368 | $36,621 | $3,707 | $32,914 |
| 2021 | $2,124 | $36,621 | $3,707 | $32,914 |
| 2020 | $2,088 | $36,620 | $3,710 | $32,910 |
| 2019 | $1,669 | $27,170 | $3,670 | $23,500 |
| 2018 | $1,643 | $27,170 | $3,610 | $23,560 |
| 2017 | $1,502 | $27,170 | $3,610 | $23,560 |
| 2016 | $1,545 | $24,060 | $3,610 | $20,450 |
| 2015 | $1,502 | $24,060 | $3,610 | $20,450 |
| 2014 | $1,503 | $24,060 | $3,610 | $20,450 |
| 2013 | $1,642 | $26,550 | $3,610 | $22,940 |
Source: Public Records
Map
Nearby Homes
- 4901 Independence Cir Unit B
- 4917 Independence Cir Unit B
- 4621 Graford Ln
- 2444 Port Charles Dr
- 2418 Wrens Dr S Unit G
- 2380 Port Williams Dr Unit 2380
- 4901 Pebblehurst Dr
- 4903 Fishcreek Rd Unit 11B
- 0 Stow Rd Unit 5102979
- 4731 Haughton Ct
- 2327 Crockett Cir
- 2140 Woodlawn Cir Unit 2144
- 4227 Baird Rd
- 4131 Burton Dr
- 5465 Park Vista Ct
- 2028 Willowdale Dr
- 3165 Peterboro Dr
- 4120 Klein Ave
- 1995 Willowdale Dr
- 1627 Cypress Ct
- 4926 Independence Cir
- 4926 Independence Cir Unit 29D
- 4926 Independence Cir Unit 29B
- 4926 Independence Cir Unit D
- 4926 Independence Cir Unit A
- 4922 Independence Cir Unit B
- 4922 Independence Cir
- 4922 Independence Cir
- 4922 Independence Cir
- 4922 Independence Cir Unit 30C
- 4922 Independence Cir Unit D
- 4922 Independence Cir Unit C
- 4931 Friar Rd
- 4931 Friar Rd Unit 28A
- 4931 Friar Rd
- 4931 Friar Rd
- 4931 Friar Rd Unit B
- 4931 Friar Rd Unit c
- 4927 Friar Rd Unit 27A
- 4927 Friar Rd Unit 27C