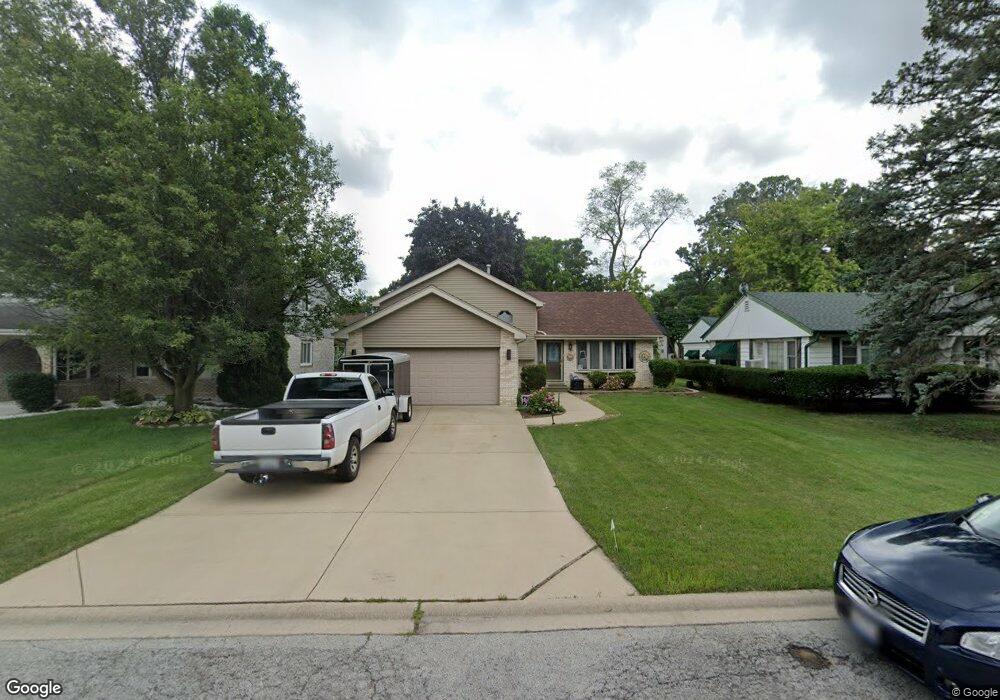
4927 144th St Midlothian, IL 60445
Estimated Value: $291,000 - $353,344
3
Beds
3
Baths
1,440
Sq Ft
$230/Sq Ft
Est. Value
About This Home
This home is located at 4927 144th St, Midlothian, IL 60445 and is currently estimated at $331,836, approximately $230 per square foot. 4927 144th St is a home located in Cook County with nearby schools including Kerkstra Elementary School, Jack Hille Middle School, and Oak Forest High School.
Ownership History
Date
Name
Owned For
Owner Type
Purchase Details
Closed on
Jun 5, 2017
Sold by
Chopp Joseph T and Chopp Wanda A
Bought by
Chopp Joseph T and Chopp Wanda A
Current Estimated Value
Purchase Details
Closed on
Sep 3, 1999
Sold by
Rapp Builders Inc
Bought by
Chopp Joseph T and Chopp Wanda A
Home Financials for this Owner
Home Financials are based on the most recent Mortgage that was taken out on this home.
Original Mortgage
$146,000
Interest Rate
7.93%
Purchase Details
Closed on
Apr 15, 1999
Sold by
Rocco Ross J and Rocco Ann Marie
Bought by
Rapp Builders Inc
Home Financials for this Owner
Home Financials are based on the most recent Mortgage that was taken out on this home.
Original Mortgage
$160,000
Interest Rate
7.75%
Mortgage Type
Construction
Create a Home Valuation Report for This Property
The Home Valuation Report is an in-depth analysis detailing your home's value as well as a comparison with similar homes in the area
Home Values in the Area
Average Home Value in this Area
Purchase History
| Date | Buyer | Sale Price | Title Company |
|---|---|---|---|
| Chopp Joseph T | -- | None Available | |
| Chopp Joseph T | $198,500 | First American Title | |
| Rapp Builders Inc | $45,000 | -- |
Source: Public Records
Mortgage History
| Date | Status | Borrower | Loan Amount |
|---|---|---|---|
| Previous Owner | Chopp Joseph T | $146,000 | |
| Previous Owner | Rapp Builders Inc | $160,000 |
Source: Public Records
Tax History Compared to Growth
Tax History
| Year | Tax Paid | Tax Assessment Tax Assessment Total Assessment is a certain percentage of the fair market value that is determined by local assessors to be the total taxable value of land and additions on the property. | Land | Improvement |
|---|---|---|---|---|
| 2024 | $8,641 | $27,408 | $3,216 | $24,192 |
| 2023 | $7,133 | $27,408 | $3,216 | $24,192 |
| 2022 | $7,133 | $18,802 | $2,814 | $15,988 |
| 2021 | $6,973 | $18,802 | $2,814 | $15,988 |
| 2020 | $6,782 | $18,802 | $2,814 | $15,988 |
| 2019 | $7,467 | $20,581 | $2,613 | $17,968 |
| 2018 | $7,315 | $20,581 | $2,613 | $17,968 |
| 2017 | $7,114 | $20,581 | $2,613 | $17,968 |
| 2016 | $6,555 | $17,792 | $2,211 | $15,581 |
| 2015 | $6,353 | $17,792 | $2,211 | $15,581 |
| 2014 | $6,927 | $19,619 | $2,211 | $17,408 |
| 2013 | $6,651 | $21,032 | $2,211 | $18,821 |
Source: Public Records
Map
Nearby Homes
- 14457 Lamon Ave Unit 3N
- 4653 146th St
- 14137 Kilpatrick Ave
- 14341 Kenton Ave
- 5018 Midlothian Turnpike Unit 1009
- 14602 Kenton Ave
- 14603 Kenton Ave
- 14063 Kilpatrick Ave
- 14710 Kenton Ave
- 14704 Kenton Ave
- 5041 139th Place Unit 406
- 13919 W Leamington Dr Unit 806
- 14317 Kilbourne Ave
- 14840 Kilpatrick Ave Unit 604
- 14913 Sheila Ct
- 13933 James Dr Unit 816
- 14833 Kilpatrick Ave
- 14815 Kenton Ave Unit 1
- 13913 James Dr Unit 1017
- 14244 Kostner Ave
- 4925 144th St
- 4929 144th St
- 4921 144th St
- 4924 144th Place
- 4928 144th Place
- 4960 144th Place
- 4920 144th Place
- 4917 144th St
- 4924 144th St
- 18 Billy Casper Ln Unit B
- 22 Billy Casper Ln
- 17 Billy Casper Ln
- 4920 144th St
- 4928 144th St
- 16 Billy Casper Ln
- 4916 144th Place
- 21 Billy Casper Ln
- 21 Billy Casper Ln Unit 21
- 4916 144th St
- 4913 144th St