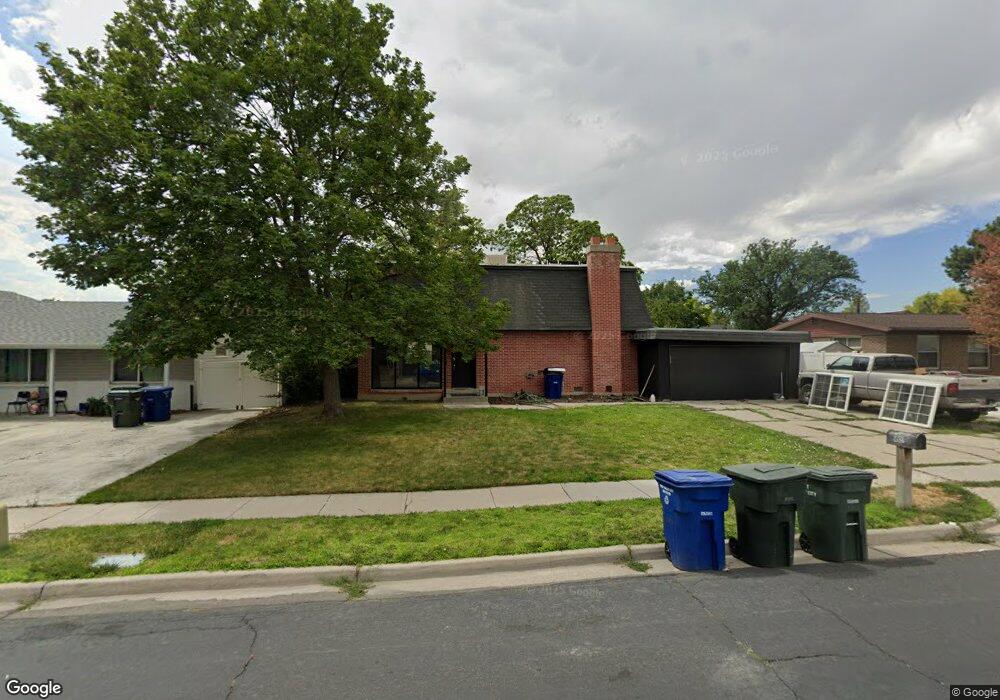
4927 W Panamint Rd Salt Lake City, UT 84120
Hunter NeighborhoodEstimated Value: $462,000 - $520,000
4
Beds
3
Baths
2,100
Sq Ft
$231/Sq Ft
Est. Value
About This Home
This home is located at 4927 W Panamint Rd, Salt Lake City, UT 84120 and is currently estimated at $484,730, approximately $230 per square foot. 4927 W Panamint Rd is a home located in Salt Lake County with nearby schools including Jackling Elementary School, Kennedy Junior High School, and Hunter High School.
Ownership History
Date
Name
Owned For
Owner Type
Purchase Details
Closed on
Sep 22, 2021
Sold by
Rocha Daniel
Bought by
Rocha Daniel and Hernandez-Rodriguez Maria G
Current Estimated Value
Home Financials for this Owner
Home Financials are based on the most recent Mortgage that was taken out on this home.
Original Mortgage
$24,272
Outstanding Balance
$22,086
Interest Rate
2.8%
Mortgage Type
Stand Alone Second
Estimated Equity
$462,644
Purchase Details
Closed on
Sep 21, 2021
Sold by
Rocha Daniel
Bought by
Rocha Daniel and Hernandez Rordriguez Maria
Home Financials for this Owner
Home Financials are based on the most recent Mortgage that was taken out on this home.
Original Mortgage
$24,272
Outstanding Balance
$22,086
Interest Rate
2.8%
Mortgage Type
Stand Alone Second
Estimated Equity
$462,644
Purchase Details
Closed on
Jan 3, 2020
Sold by
Gallagher George C
Bought by
Dutta Debashish
Home Financials for this Owner
Home Financials are based on the most recent Mortgage that was taken out on this home.
Original Mortgage
$299,250
Interest Rate
3.6%
Mortgage Type
New Conventional
Purchase Details
Closed on
Aug 26, 2013
Sold by
Secretary Of Hud
Bought by
Gallagher George C
Home Financials for this Owner
Home Financials are based on the most recent Mortgage that was taken out on this home.
Original Mortgage
$5,600
Interest Rate
4.25%
Mortgage Type
FHA
Purchase Details
Closed on
Apr 3, 2013
Sold by
Jpmorgan Chase Bank
Bought by
Secretary Of Hud
Purchase Details
Closed on
Mar 25, 2013
Sold by
Lapuaho Samipeni U and Lapuaho Kelly J
Bought by
Jpmorgan Chase Bank N A
Purchase Details
Closed on
Nov 20, 2002
Sold by
Michel Investments Llc
Bought by
Lapuaho Samipeni U and Lapuaho Kelly J
Home Financials for this Owner
Home Financials are based on the most recent Mortgage that was taken out on this home.
Original Mortgage
$127,400
Interest Rate
5.89%
Mortgage Type
FHA
Purchase Details
Closed on
Sep 5, 2002
Sold by
Woodbridge Realty Llc
Bought by
Michel Investments Llc
Purchase Details
Closed on
Jul 10, 2002
Sold by
Michel Investments Llc
Bought by
Woodbridge Realty Lc
Purchase Details
Closed on
Jun 25, 2002
Sold by
Johnson Kathleen W
Bought by
Michel Investments Llc
Purchase Details
Closed on
Dec 30, 1998
Sold by
Johnson Brian T
Bought by
Johnson Kathleen W
Home Financials for this Owner
Home Financials are based on the most recent Mortgage that was taken out on this home.
Original Mortgage
$98,000
Interest Rate
6.73%
Create a Home Valuation Report for This Property
The Home Valuation Report is an in-depth analysis detailing your home's value as well as a comparison with similar homes in the area
Home Values in the Area
Average Home Value in this Area
Purchase History
| Date | Buyer | Sale Price | Title Company |
|---|---|---|---|
| Rocha Daniel | -- | Inwest Title | |
| Rocha Daniel | -- | Inwest Title Srvs Slc | |
| Rocha Daniel | -- | Truly Title Inc | |
| Dutta Debashish | -- | Inwest Title Srvs Slc | |
| Gallagher George C | -- | Cornerstone Title Ins Agcy | |
| Secretary Of Hud | -- | Backman Title Services | |
| Jpmorgan Chase Bank N A | $123,546 | Etitle Insurance Agency | |
| Lapuaho Samipeni U | -- | Merrill Title | |
| Michel Investments Llc | -- | Meridian Title | |
| Woodbridge Realty Lc | -- | Merrill Title | |
| Michel Investments Llc | $67,500 | -- | |
| Johnson Kathleen W | -- | Inwest Title Services |
Source: Public Records
Mortgage History
| Date | Status | Borrower | Loan Amount |
|---|---|---|---|
| Open | Rocha Daniel | $24,272 | |
| Open | Rocha Daniel | $404,537 | |
| Previous Owner | Dutta Debashish | $299,250 | |
| Previous Owner | Gallagher George C | $5,600 | |
| Previous Owner | Lapuaho Samipeni U | $127,400 | |
| Previous Owner | Johnson Kathleen W | $98,000 |
Source: Public Records
Tax History Compared to Growth
Tax History
| Year | Tax Paid | Tax Assessment Tax Assessment Total Assessment is a certain percentage of the fair market value that is determined by local assessors to be the total taxable value of land and additions on the property. | Land | Improvement |
|---|---|---|---|---|
| 2025 | $2,642 | $428,000 | $140,200 | $287,800 |
| 2024 | $2,642 | $403,400 | $132,500 | $270,900 |
| 2023 | $2,642 | $383,300 | $127,400 | $255,900 |
| 2022 | $2,686 | $393,600 | $124,900 | $268,700 |
| 2021 | $2,430 | $320,000 | $96,100 | $223,900 |
| 2020 | $2,213 | $275,000 | $73,900 | $201,100 |
| 2019 | $1,935 | $232,000 | $63,800 | $168,200 |
| 2018 | $1,830 | $211,800 | $63,800 | $148,000 |
| 2017 | $1,691 | $199,000 | $63,800 | $135,200 |
| 2016 | $1,575 | $185,700 | $60,300 | $125,400 |
| 2015 | $1,318 | $148,000 | $65,800 | $82,200 |
| 2014 | $1,277 | $140,500 | $63,700 | $76,800 |
Source: Public Records
Map
Nearby Homes
- 3697 S Havasu Way
- 3740 S 4800 W
- 4878 W Seneca Rd
- 3779 S 4800 W
- 5049 W Candice Wood Cir
- 4832 W 3850 S
- 4961 W 3850 S
- 4655 W Valley Villa Dr Unit C
- 5133 W Village Wood Dr
- 5149 W Village Wood Dr
- 5235 W Rancho Vista Ln
- 3910 Boothill Dr
- 3906 Boothill Cir
- 5200 W 3500 S
- 4915 W Janette Ave
- 3978 S 4800 W
- 3527 S Lydia Ann Ln Unit 6
- 3886 Atlas Way
- 3511 S Lydia Ann Ln
- 4863 W 3280 S
- 4937 Panamint Rd
- 4939 Panamint Rd
- 4917 Panamint Rd
- 4917 W Panamint Rd
- 4926 Havasu Way
- 4938 Havasu Way
- 4938 W Havasu Way
- 4916 Havasu Way
- 4951 Panamint Rd
- 4951 W Panamint Rd
- 4907 W Panamint Rd
- 4907 Panamint Rd
- 4930 Panamint Rd
- 4930 W Panamint Rd
- 4920 W Panamint Rd
- 4920 Panamint Rd
- 4950 Havasu Way
- 4906 Havasu Way
- 4946 Panamint Rd
- 4912 Panamint Rd