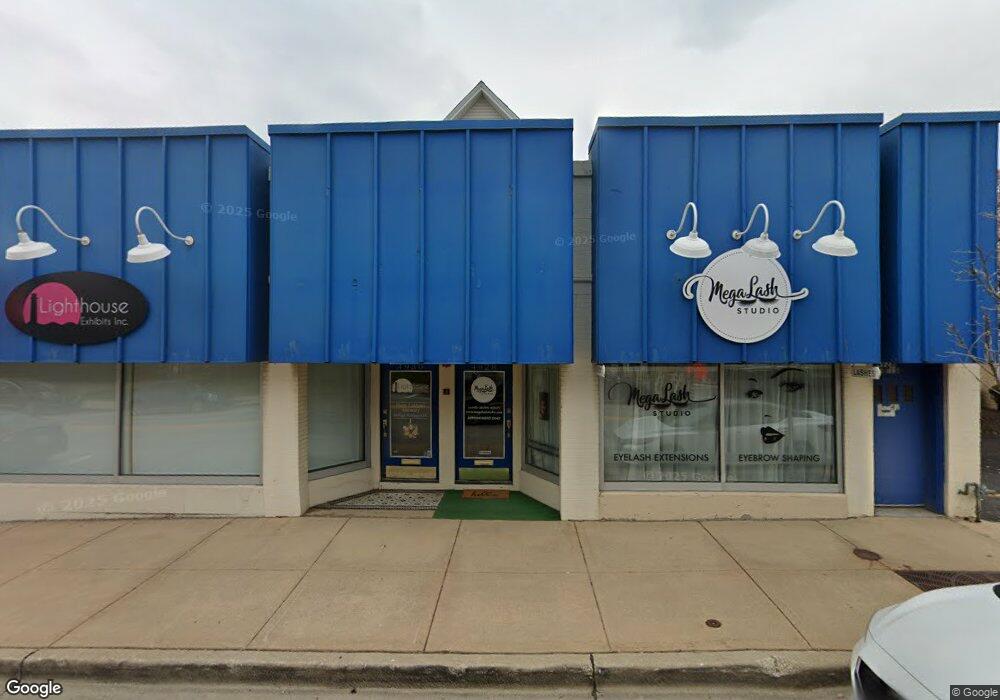
4928 Main St Downers Grove, IL 60515
Estimated Value: $600,247
--
Bed
--
Bath
1,500
Sq Ft
$400/Sq Ft
Est. Value
About This Home
This home is located at 4928 Main St, Downers Grove, IL 60515 and is currently estimated at $600,247, approximately $400 per square foot. 4928 Main St is a home located in DuPage County with nearby schools including Pierce Downer Elementary School, Herrick Middle School, and Downer Grove North High School.
Ownership History
Date
Name
Owned For
Owner Type
Purchase Details
Closed on
May 20, 2011
Sold by
Synergy Property Holdings Llc
Bought by
Dupage Holdings Llc
Current Estimated Value
Purchase Details
Closed on
Jul 27, 2010
Sold by
Meilus Linas and Meilus Teresa
Bought by
Synergy Property Holdings Llc
Purchase Details
Closed on
Nov 17, 1999
Sold by
Meilus Linas and Meilus Teresa
Bought by
Meilus Linas and Meilus Teresa
Purchase Details
Closed on
Mar 21, 1997
Sold by
Leto James J
Bought by
Meilus Linas and Meilus Teresa
Home Financials for this Owner
Home Financials are based on the most recent Mortgage that was taken out on this home.
Original Mortgage
$224,250
Interest Rate
8.75%
Mortgage Type
Commercial
Purchase Details
Closed on
Mar 10, 1997
Sold by
Reklaitis Vytautas and Reklaitis Rima
Bought by
Leto James J
Home Financials for this Owner
Home Financials are based on the most recent Mortgage that was taken out on this home.
Original Mortgage
$224,250
Interest Rate
8.75%
Mortgage Type
Commercial
Create a Home Valuation Report for This Property
The Home Valuation Report is an in-depth analysis detailing your home's value as well as a comparison with similar homes in the area
Home Values in the Area
Average Home Value in this Area
Purchase History
| Date | Buyer | Sale Price | Title Company |
|---|---|---|---|
| Dupage Holdings Llc | $305,000 | Ctic | |
| Synergy Property Holdings Llc | -- | None Available | |
| Meilus Linas | -- | -- | |
| Meilus Linas | $299,000 | Attorneys Title Guaranty Fun | |
| Leto James J | $230,000 | Attorneys Title Guaranty Fun |
Source: Public Records
Mortgage History
| Date | Status | Borrower | Loan Amount |
|---|---|---|---|
| Previous Owner | Meilus Linas | $224,250 |
Source: Public Records
Tax History Compared to Growth
Tax History
| Year | Tax Paid | Tax Assessment Tax Assessment Total Assessment is a certain percentage of the fair market value that is determined by local assessors to be the total taxable value of land and additions on the property. | Land | Improvement |
|---|---|---|---|---|
| 2024 | $7,115 | $110,950 | $107,660 | $3,290 |
| 2023 | $7,352 | $109,210 | $98,970 | $10,240 |
| 2022 | $7,426 | $109,210 | $91,640 | $17,570 |
| 2021 | $7,046 | $107,970 | $90,600 | $17,370 |
| 2020 | $7,322 | $103,320 | $85,210 | $18,110 |
| 2019 | $7,385 | $103,320 | $85,210 | $18,110 |
| 2018 | $8,058 | $111,680 | $81,150 | $30,530 |
| 2017 | $10,924 | $150,440 | $78,090 | $72,350 |
| 2016 | $9,241 | $124,360 | $74,530 | $49,830 |
| 2015 | $9,073 | $117,000 | $70,120 | $46,880 |
| 2014 | $11,137 | $140,160 | $68,180 | $71,980 |
| 2013 | $10,945 | $139,500 | $67,860 | $71,640 |
Source: Public Records
Map
Nearby Homes
- 4929 Forest Ave Unit 4F
- 965 Rogers St Unit 202
- 4900 Forest Ave Unit 108
- 4900 Forest Ave Unit 201
- 4900 Forest Ave Unit 308
- 4900 Forest Ave Unit 204
- 4900 Forest Ave Unit 205
- 918 Rogers St Unit 103
- 841 Rogers St
- 1110 Grove St Unit 4H
- 4829 Linscott Ave
- 4731 Saratoga Ave
- 4941 Montgomery Ave
- 5329 Main St Unit 502
- 4812 Oakwood Ave
- 1360 Turvey Rd
- 4741 Montgomery Ave
- 5313 Washington St
- 4533 Highland Ave
- 4637 Oakwood Ave
- 4930 Main St
- 4932 Main St Unit 2NDFLOOR
- 4920 Main St
- 4927 Main St
- 4927 Main St Unit 2R
- 4927 Main St Unit 1R
- 4927 Main St Unit 1F
- 4946 Main St
- 4929 Forest Ave Unit 4G
- 4929 Forest Ave Unit 3G
- 4929 Forest Ave Unit 2G
- 4929 Forest Ave Unit 1G
- 4929 Forest Ave Unit 3F
- 4929 Forest Ave Unit 2F
- 4929 Forest Ave Unit 1F
- 4929 Forest Ave Unit 4E
- 4929 Forest Ave Unit 3E
- 4929 Forest Ave Unit 2E
- 4929 Forest Ave Unit 1E
- 4929 Forest Ave Unit 3D