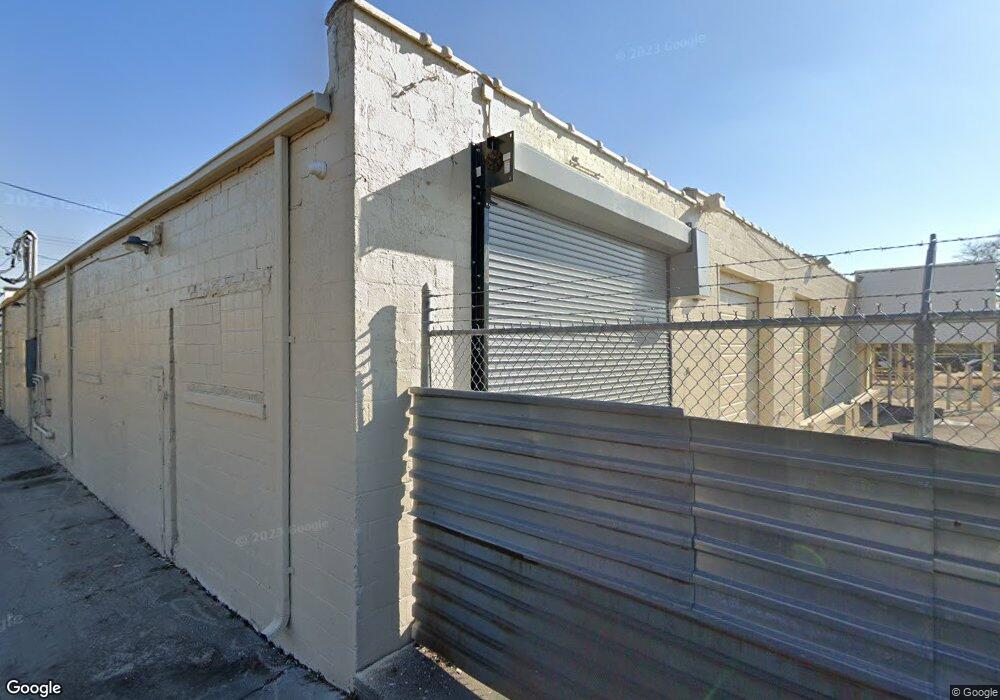
4929 E McNichols Rd HamtraMcK, MI 48212
Davison NeighborhoodEstimated Value: $137,841
Studio
--
Bath
8,000
Sq Ft
$17/Sq Ft
Est. Value
About This Home
This home is located at 4929 E McNichols Rd, HamtraMcK, MI 48212 and is currently estimated at $137,841, approximately $17 per square foot. 4929 E McNichols Rd is a home located in Wayne County with nearby schools including Davison Elementary-Middle School, Edward 'Duke' Ellington Conservatory of Music and Art, and Charles L. Spain Elementary-Middle School.
Ownership History
Date
Name
Owned For
Owner Type
Purchase Details
Closed on
Oct 22, 2020
Sold by
Garmo Management Company Llc
Bought by
Ajs Transportation Llc
Current Estimated Value
Purchase Details
Closed on
Sep 24, 2020
Sold by
Big Star G Llc
Bought by
Ass Transportation Llc
Purchase Details
Closed on
Jan 22, 2016
Sold by
Big Star G Llc
Bought by
Laj S Transportation Lc
Purchase Details
Closed on
Apr 14, 2015
Sold by
Mathis Vanessa
Bought by
Big Star G Llc
Purchase Details
Closed on
Nov 16, 2012
Sold by
Wayne County Treasurer
Bought by
Mathis Vanessa
Purchase Details
Closed on
Nov 17, 2010
Sold by
Lance Chris Properties Llc
Bought by
Garmo Management Company Llc
Purchase Details
Closed on
Jul 27, 2004
Sold by
Dabish Marvin
Bought by
Lance Chris Properties Llc
Create a Home Valuation Report for This Property
The Home Valuation Report is an in-depth analysis detailing your home's value as well as a comparison with similar homes in the area
Home Values in the Area
Average Home Value in this Area
Purchase History
| Date | Buyer | Sale Price | Title Company |
|---|---|---|---|
| Ajs Transportation Llc | -- | None Available | |
| Youhana Fowzie | $100,000 | None Available | |
| Ass Transportation Llc | $70,000 | None Available | |
| Laj S Transportation Lc | -- | Attorney | |
| Big Star G Llc | $50,000 | None Available | |
| Big Star G Llc | -- | None Available | |
| Mathis Vanessa | $900 | None Available | |
| Garmo Management Company Llc | $50,000 | None Available | |
| Lance Chris Properties Llc | $300,000 | Transnation Title |
Source: Public Records
Tax History
| Year | Tax Paid | Tax Assessment Tax Assessment Total Assessment is a certain percentage of the fair market value that is determined by local assessors to be the total taxable value of land and additions on the property. | Land | Improvement |
|---|---|---|---|---|
| 2025 | $6,342 | $115,400 | $0 | $0 |
| 2024 | $6,291 | $115,800 | $0 | $0 |
| 2023 | $6,125 | $106,700 | $0 | $0 |
| 2022 | $6,616 | $94,100 | $0 | $0 |
| 2021 | $10,498 | $116,100 | $0 | $0 |
| 2020 | $8,412 | $113,800 | $0 | $0 |
| 2019 | $6,280 | $114,200 | $0 | $0 |
| 2018 | $5,351 | $71,500 | $0 | $0 |
| 2017 | $1,267 | $66,800 | $0 | $0 |
| 2016 | $5,954 | $163,800 | $0 | $0 |
| 2015 | $6,580 | $65,800 | $0 | $0 |
| 2013 | $6,585 | $65,850 | $0 | $0 |
| 2010 | -- | $70,918 | $22,131 | $48,787 |
Source: Public Records
Map
Nearby Homes
- 17333 Fenelon St
- 13500 Fenelon St
- 17138 Eureka St
- 17257 Moenart St
- 17144 Justine St
- 13401 Justine St
- 13402 Dean St
- 13763 Sparling St
- 13757 Sparling St
- 13242 Buffalo St
- 13291 Sparling St
- 4590 Charles St
- 5092 Charles St
- 13286 Gable St
- 13768 Gable St
- 17178 Gable St
- 12621 Moran St
- 6000 E McNichols Rd
- 13512 Gable St
- 3875 Sobieski St
- 17124 Lamont St
- 17130 Lamont St
- 17131 Fenelon St
- 17136 Lamont St
- 17137 Fenelon St
- 17142 Lamont St
- 17145 Fenelon St
- 17149 Fenelon St
- 17127 Lamont St
- 17154 Lamont St
- 17131 Lamont St
- 17137 Lamont St
- 17130 Fenelon St
- 4870 E Davison St
- 17160 Lamont St
- 5000 E McNichols Rd
- 4856 E Davison St
- 17143 Lamont St
- 17140 Fenelon St
- 4850 E Davison St
Your Personal Tour Guide
Ask me questions while you tour the home.