Estimated Value: $173,000 - $197,000
2
Beds
2
Baths
1,366
Sq Ft
$135/Sq Ft
Est. Value
About This Home
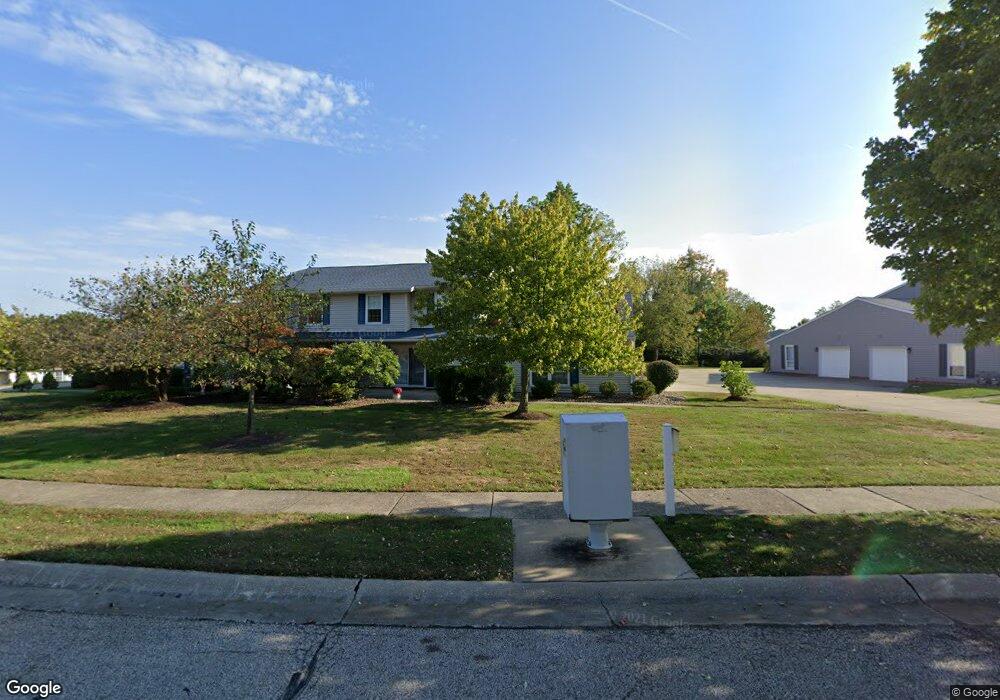
This home is located at 4929 Independence Cir Unit 9C, Stow, OH 44224 and is currently estimated at $183,955, approximately $134 per square foot. 4929 Independence Cir Unit 9C is a home located in Summit County with nearby schools including Stow-Munroe Falls High School, Primrose School of Hudson, and Holy Family Elementary School.
Ownership History
Date
Name
Owned For
Owner Type
Purchase Details
Closed on
May 8, 2019
Sold by
Adkins Mary Anne
Bought by
Davidson Judith A
Current Estimated Value
Purchase Details
Closed on
Apr 6, 2007
Sold by
Adkins Robert S
Bought by
Adkins Mary Anne
Purchase Details
Closed on
Jun 5, 2006
Sold by
Harrell Judy and Harrell Richard
Bought by
Adkins Mary Anne
Home Financials for this Owner
Home Financials are based on the most recent Mortgage that was taken out on this home.
Original Mortgage
$102,600
Interest Rate
6.66%
Mortgage Type
Fannie Mae Freddie Mac
Purchase Details
Closed on
Sep 22, 2002
Sold by
Judith Myers
Bought by
Gibbons Judy
Home Financials for this Owner
Home Financials are based on the most recent Mortgage that was taken out on this home.
Original Mortgage
$103,350
Interest Rate
6.34%
Create a Home Valuation Report for This Property
The Home Valuation Report is an in-depth analysis detailing your home's value as well as a comparison with similar homes in the area
Home Values in the Area
Average Home Value in this Area
Purchase History
| Date | Buyer | Sale Price | Title Company |
|---|---|---|---|
| Davidson Judith A | $125,000 | American Kingdom | |
| Adkins Mary Anne | -- | Title Professionals Inc | |
| Adkins Mary Anne | $114,000 | Revere Title Summit County | |
| Gibbons Judy | $108,800 | Miller Examining Service Inc |
Source: Public Records
Mortgage History
| Date | Status | Borrower | Loan Amount |
|---|---|---|---|
| Previous Owner | Adkins Mary Anne | $102,600 | |
| Previous Owner | Gibbons Judy | $103,350 |
Source: Public Records
Tax History Compared to Growth
Tax History
| Year | Tax Paid | Tax Assessment Tax Assessment Total Assessment is a certain percentage of the fair market value that is determined by local assessors to be the total taxable value of land and additions on the property. | Land | Improvement |
|---|---|---|---|---|
| 2025 | $2,418 | $51,496 | $5,075 | $46,421 |
| 2024 | $2,418 | $51,496 | $5,075 | $46,421 |
| 2023 | $2,418 | $51,496 | $5,075 | $46,421 |
| 2022 | $1,878 | $37,591 | $3,707 | $33,884 |
| 2021 | $1,685 | $37,591 | $3,707 | $33,884 |
| 2020 | $1,657 | $37,590 | $3,710 | $33,880 |
| 2019 | $1,654 | $26,920 | $3,670 | $23,250 |
| 2018 | $1,628 | $26,920 | $3,610 | $23,310 |
| 2017 | $1,488 | $26,920 | $3,610 | $23,310 |
| 2016 | $1,530 | $23,830 | $3,610 | $20,220 |
| 2015 | $1,488 | $23,830 | $3,610 | $20,220 |
| 2014 | $1,489 | $23,830 | $3,610 | $20,220 |
| 2013 | $1,830 | $29,710 | $3,610 | $26,100 |
Source: Public Records
Map
Nearby Homes
- 4910 Independence Cir Unit D
- 4916 Friar Rd Unit B
- 4638 Dresher Trail
- 2410 Wrens Dr S
- 0 Stow Rd Unit 5102979
- 4846 Garnet Cir
- 4556 Fishcreek Rd
- 2188 Duxbury
- 2714 Wexford Blvd
- 4322 Lorwood Dr
- 2798 E Celeste View Dr
- 2279 Becket Cir
- 2908 Wexford Blvd
- 4444 Hickory Trail
- 4462 Timberdale Dr
- 4445 Kenneth Trail
- 4424 Timberdale Dr Unit 4428
- 5361 Diana Lynn Dr
- 4155 Burton Dr
- 5131 Bayside Lake Blvd
- 4929 Independence Cir
- 4929 Independence Cir Unit 9B
- 4929 Independence Cir
- 4929 Independence Cir Unit A
- 4929 Independence Cir Unit C
- 4929 Independence Cir Unit B
- 4929 Independence Cir Unit D
- 2590 Jefferson Place Unit 10A
- 2590 Jefferson Place
- 2590 Jefferson Place
- 2590 Jefferson Place
- 2590 Jefferson Place Unit A
- 2590 Jefferson Place Unit D
- 2590 Jefferson Place Unit C
- 4941 Friar Rd
- 4943 Friar Rd Unit 4941
- 4926 Independence Cir
- 4926 Independence Cir Unit 29A
- 4926 Independence Cir Unit 29D
- 4926 Independence Cir Unit 29B