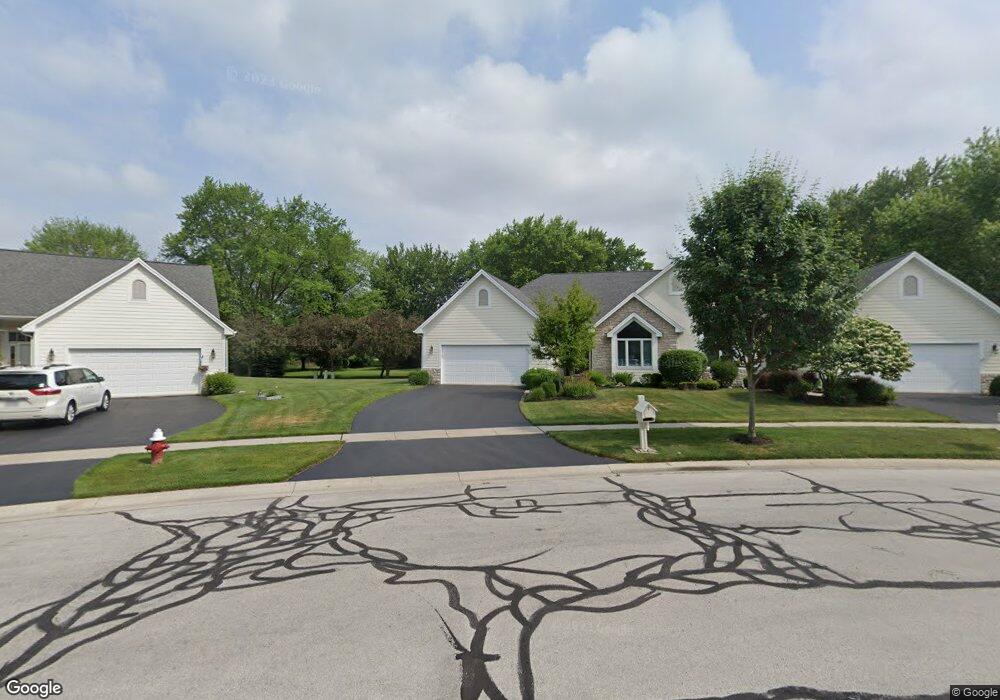
4929 Marble Cliff Blvd Sylvania, OH 43560
Estimated Value: $287,000 - $344,000
3
Beds
2
Baths
1,728
Sq Ft
$183/Sq Ft
Est. Value
About This Home
This home is located at 4929 Marble Cliff Blvd, Sylvania, OH 43560 and is currently estimated at $316,232, approximately $183 per square foot. 4929 Marble Cliff Blvd is a home located in Lucas County with nearby schools including Maplewood Elementary School, Sylvania McCord Junior High School, and Sylvania Northview High School.
Ownership History
Date
Name
Owned For
Owner Type
Purchase Details
Closed on
Mar 29, 2024
Sold by
Betty J Krahn Living Trust and Richard A Krahn Living Trust
Bought by
Craig R Johnson And Kathryn B Johnson Trust and Johnson
Current Estimated Value
Purchase Details
Closed on
Nov 4, 2022
Sold by
Krahn Betty Jane and Krahn Richard Allen
Bought by
Betty J Krahn Living Trust and Richard A Krahn Living Trust
Purchase Details
Closed on
Feb 8, 2019
Sold by
Tidd Karen K and Karcher Karen J
Bought by
Krahn Betty Jane and Krahn Richard Allen
Purchase Details
Closed on
Feb 11, 2004
Sold by
Midland Agency Of Northwest Ohio Inc
Bought by
Karcher Karen J
Home Financials for this Owner
Home Financials are based on the most recent Mortgage that was taken out on this home.
Original Mortgage
$163,920
Interest Rate
5.74%
Mortgage Type
Purchase Money Mortgage
Create a Home Valuation Report for This Property
The Home Valuation Report is an in-depth analysis detailing your home's value as well as a comparison with similar homes in the area
Home Values in the Area
Average Home Value in this Area
Purchase History
| Date | Buyer | Sale Price | Title Company |
|---|---|---|---|
| Craig R Johnson And Kathryn B Johnson Trust | $280,000 | None Listed On Document | |
| Betty J Krahn Living Trust | -- | -- | |
| Krahn Betty Jane | $235,000 | Area Title Agency Inc | |
| Karcher Karen J | $204,900 | Midland |
Source: Public Records
Mortgage History
| Date | Status | Borrower | Loan Amount |
|---|---|---|---|
| Previous Owner | Karcher Karen J | $163,920 |
Source: Public Records
Tax History Compared to Growth
Tax History
| Year | Tax Paid | Tax Assessment Tax Assessment Total Assessment is a certain percentage of the fair market value that is determined by local assessors to be the total taxable value of land and additions on the property. | Land | Improvement |
|---|---|---|---|---|
| 2024 | $2,566 | $81,655 | $10,465 | $71,190 |
| 2023 | $5,092 | $70,665 | $8,855 | $61,810 |
| 2022 | $5,100 | $70,665 | $8,855 | $61,810 |
| 2021 | $5,234 | $70,665 | $8,855 | $61,810 |
| 2020 | $5,117 | $61,390 | $10,570 | $50,820 |
| 2019 | $4,920 | $61,390 | $10,570 | $50,820 |
| 2018 | $4,881 | $61,390 | $10,570 | $50,820 |
| 2017 | $5,259 | $59,990 | $10,325 | $49,665 |
| 2016 | $5,154 | $171,400 | $29,500 | $141,900 |
| 2015 | $4,845 | $171,400 | $29,500 | $141,900 |
| 2014 | $4,560 | $57,680 | $9,940 | $47,740 |
| 2013 | $4,560 | $57,680 | $9,940 | $47,740 |
Source: Public Records
Map
Nearby Homes
- 4902 Marble Cliff Blvd
- 7430 Country Commons Ln
- 5046 King Rd
- 7639 Cobblestone Dr
- 7345 Country Commons Ln
- 5060 Olde Mill Ct
- 7428 Kings Walk Ln
- 4761 Tamworth Rd
- 4850 Tamworth Rd
- 4504 Promenade Ln
- 4731 Weldwood Ln
- 5310 Turnberry Ln
- 7325 Winsford Ln
- 5308 Radcliffe Rd
- 7122 Brint Rd
- 4845 Westcliffe Ct
- 4610 Woodland Ln
- 8826 Flint Ct
- 8729 Harlow Ct
- 8816 Harlow Ct
- 4935 Marble Cliff Blvd
- 4923 Marble Cliff Blvd
- 4917 Marble Cliff Blvd
- 4906 Marble Cliff Blvd
- 4911 Marble Cliff Blvd
- 4905 Marble Cliff Blvd
- 7535 Brint Rd
- 7451 Country Commons Ln Unit ANNEXE
- 7451 Country Commons Ln
- 4860 Marble Cliff Blvd
- 4863 Marble Cliff Blvd
- 7452 Country Commons Ln Unit 7452
- 7452 Country Commons Ln
- 7449 Country Commons Ln
- 7449 Country Commons Ln Unit 7449AN
- 4857 Marble Cliff Blvd
- 4854 Marble Cliff Blvd
- 4910 Yosemite Pkwy
- 4900 Yosemite Pkwy
- 4920 Yosemite Pkwy