Estimated Value: $460,442 - $494,000
4
Beds
3
Baths
2,126
Sq Ft
$225/Sq Ft
Est. Value
About This Home
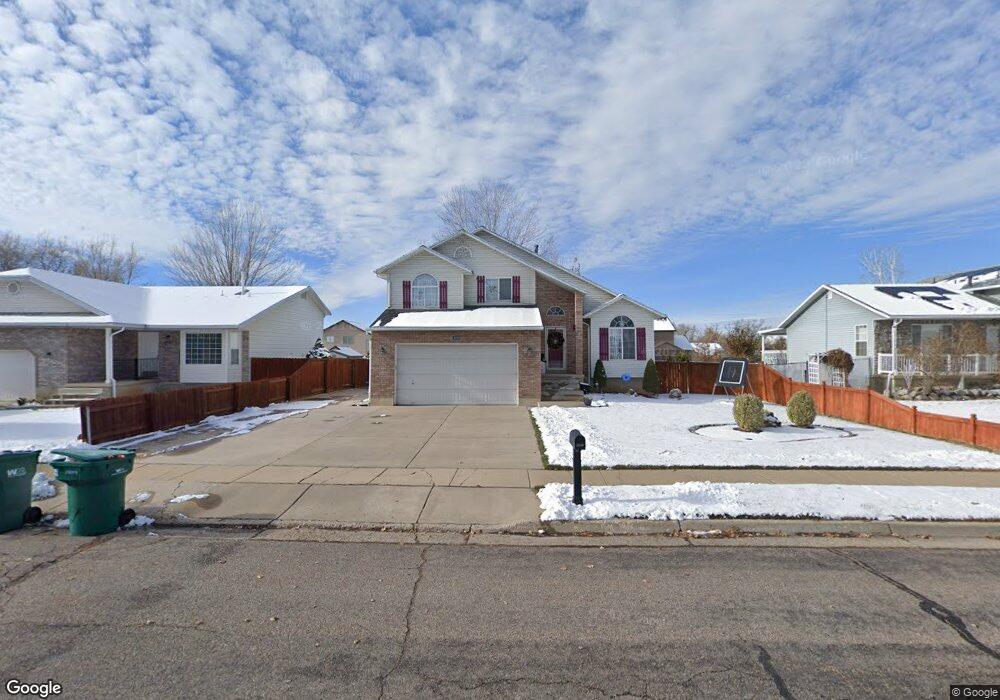
This home is located at 4929 S 3000 W, Roy, UT 84067 and is currently estimated at $477,611, approximately $224 per square foot. 4929 S 3000 W is a home located in Weber County with nearby schools including Midland School, Sand Ridge Junior High School, and Roy High School.
Ownership History
Date
Name
Owned For
Owner Type
Purchase Details
Closed on
Mar 21, 2007
Sold by
Benson Donald R and Benson Melanie C
Bought by
Wilson Mark
Current Estimated Value
Home Financials for this Owner
Home Financials are based on the most recent Mortgage that was taken out on this home.
Original Mortgage
$160,400
Outstanding Balance
$97,353
Interest Rate
6.31%
Mortgage Type
New Conventional
Estimated Equity
$380,258
Purchase Details
Closed on
Jul 28, 2004
Sold by
Lea Thomas Erik Dean and Lea Thomas Mary
Bought by
Benson Donald R
Home Financials for this Owner
Home Financials are based on the most recent Mortgage that was taken out on this home.
Original Mortgage
$158,410
Interest Rate
6.24%
Mortgage Type
VA
Purchase Details
Closed on
Aug 29, 1997
Sold by
Green Darren L and Green January
Bought by
Thomas Erik Dean
Home Financials for this Owner
Home Financials are based on the most recent Mortgage that was taken out on this home.
Original Mortgage
$102,400
Interest Rate
7.43%
Create a Home Valuation Report for This Property
The Home Valuation Report is an in-depth analysis detailing your home's value as well as a comparison with similar homes in the area
Home Values in the Area
Average Home Value in this Area
Purchase History
| Date | Buyer | Sale Price | Title Company |
|---|---|---|---|
| Wilson Mark | -- | Backman | |
| Benson Donald R | -- | First American Title | |
| Thomas Erik Dean | -- | Associated Title |
Source: Public Records
Mortgage History
| Date | Status | Borrower | Loan Amount |
|---|---|---|---|
| Open | Wilson Mark | $160,400 | |
| Previous Owner | Benson Donald R | $158,410 | |
| Previous Owner | Thomas Erik Dean | $102,400 |
Source: Public Records
Tax History
| Year | Tax Paid | Tax Assessment Tax Assessment Total Assessment is a certain percentage of the fair market value that is determined by local assessors to be the total taxable value of land and additions on the property. | Land | Improvement |
|---|---|---|---|---|
| 2025 | $2,798 | $446,876 | $130,015 | $316,861 |
| 2024 | $2,679 | $236,499 | $71,508 | $164,991 |
| 2023 | $2,588 | $228,800 | $65,864 | $162,936 |
| 2022 | $2,815 | $257,950 | $55,008 | $202,942 |
| 2021 | $2,210 | $331,000 | $75,002 | $255,998 |
| 2020 | $2,066 | $284,000 | $75,002 | $208,998 |
| 2019 | $1,981 | $256,000 | $44,989 | $211,011 |
| 2018 | $1,892 | $230,000 | $44,989 | $185,011 |
| 2017 | $1,745 | $198,000 | $44,989 | $153,011 |
| 2016 | $1,752 | $107,375 | $21,944 | $85,431 |
| 2015 | $1,514 | $94,041 | $21,944 | $72,097 |
| 2014 | $1,473 | $90,193 | $21,944 | $68,249 |
Source: Public Records
Map
Nearby Homes
- 4891 S 2875 W
- 4793 S 3025 W
- 5009 S 2925 W
- 3022 W 4750 S
- 2817 W 5000 S
- 5063 S 2825 W
- 2953 W 4650 S
- 5141 S 2975 W
- 4732 S West Park Dr
- 5155 S 3200 W
- 2581 W 5000 S
- 5304 S 3100 W
- 5321 S 3100 W
- 5125 S 2600 W
- 2602 W 4600 S
- 4510 Stone Creek Rd Unit F
- 3509 W 4835 S Unit 26
- 3517 W 4835 S Unit 27
- 4491 Haven Creek Rd Unit A
- 2568 W 5225 S
Your Personal Tour Guide
Ask me questions while you tour the home.