Estimated Value: $353,000 - $371,214
3
Beds
2
Baths
1,632
Sq Ft
$222/Sq Ft
Est. Value
About This Home
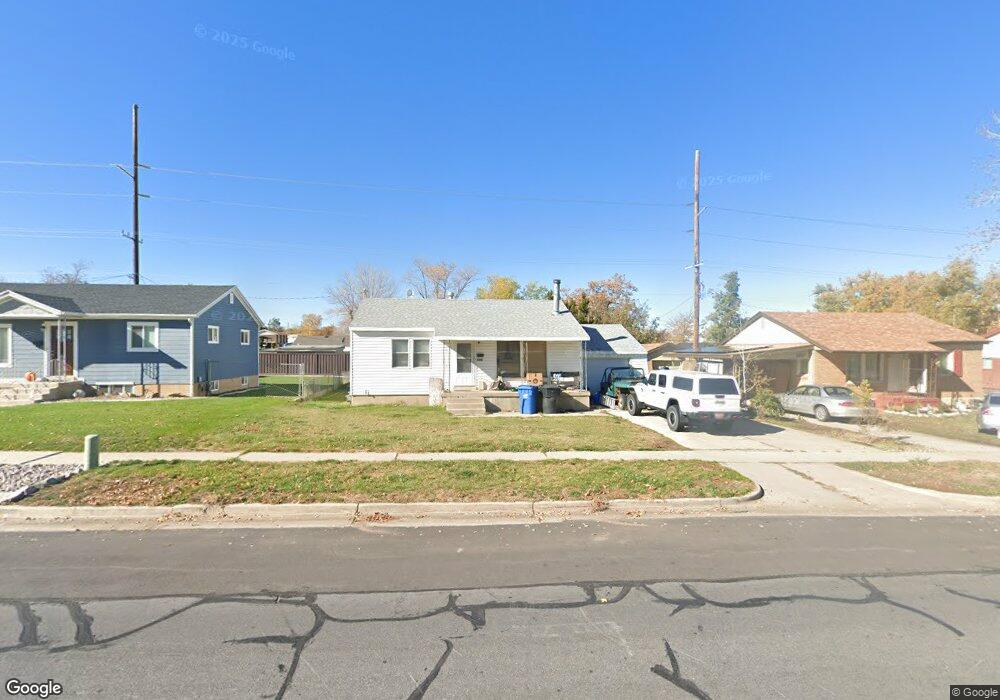
This home is located at 4929 S Ridgeline Dr, Ogden, UT 84405 and is currently estimated at $363,054, approximately $222 per square foot. 4929 S Ridgeline Dr is a home located in Weber County with nearby schools including Roosevelt School, T.H. Bell Junior High School, and Bonneville High School.
Ownership History
Date
Name
Owned For
Owner Type
Purchase Details
Closed on
Oct 16, 2024
Sold by
Jackson Miles
Bought by
Albarran Millicent and Albarran Isidoro
Current Estimated Value
Home Financials for this Owner
Home Financials are based on the most recent Mortgage that was taken out on this home.
Original Mortgage
$21,320
Outstanding Balance
$21,096
Interest Rate
6.35%
Estimated Equity
$341,958
Purchase Details
Closed on
Aug 10, 2023
Sold by
Reese Terry L
Bought by
Jackson Days
Home Financials for this Owner
Home Financials are based on the most recent Mortgage that was taken out on this home.
Original Mortgage
$323,000
Interest Rate
6.71%
Mortgage Type
New Conventional
Create a Home Valuation Report for This Property
The Home Valuation Report is an in-depth analysis detailing your home's value as well as a comparison with similar homes in the area
Home Values in the Area
Average Home Value in this Area
Purchase History
| Date | Buyer | Sale Price | Title Company |
|---|---|---|---|
| Albarran Millicent | -- | Metro National Title | |
| Jackson Days | -- | Prospect Land Title |
Source: Public Records
Mortgage History
| Date | Status | Borrower | Loan Amount |
|---|---|---|---|
| Open | Albarran Millicent | $21,320 | |
| Open | Albarran Millicent | $355,344 | |
| Previous Owner | Jackson Days | $323,000 |
Source: Public Records
Tax History Compared to Growth
Tax History
| Year | Tax Paid | Tax Assessment Tax Assessment Total Assessment is a certain percentage of the fair market value that is determined by local assessors to be the total taxable value of land and additions on the property. | Land | Improvement |
|---|---|---|---|---|
| 2025 | $2,338 | $341,191 | $110,006 | $231,185 |
| 2024 | $2,217 | $182,049 | $60,503 | $121,546 |
| 2023 | $2,277 | $188,651 | $60,429 | $128,222 |
| 2022 | $2,383 | $205,700 | $57,750 | $147,950 |
| 2021 | $1,904 | $265,000 | $54,991 | $210,009 |
| 2020 | $1,740 | $219,000 | $45,055 | $173,945 |
| 2019 | $1,693 | $197,000 | $45,055 | $151,945 |
| 2018 | $1,438 | $161,000 | $45,055 | $115,945 |
| 2017 | $1,308 | $135,000 | $29,990 | $105,010 |
| 2016 | $1,217 | $68,086 | $16,560 | $51,526 |
| 2015 | $1,234 | $68,086 | $16,560 | $51,526 |
| 2014 | $1,080 | $57,421 | $16,560 | $40,861 |
Source: Public Records
Map
Nearby Homes
- 4939 S Ridgeline Dr
- 4916 S 525 W
- 4909 S Ridgeline Dr
- 4928 S 525 W
- 4949 S Ridgeline Dr
- 4930 S Ridgeline Dr
- 4936 S 525 W
- 4936 S 525 W Unit 4
- 4920 S Ridgeline Dr
- 4940 S Ridgeline Dr
- 4910 S Ridgeline Dr
- 4959 S Ridgeline Dr
- 4910 S 500 W
- 4899 S Ridgeline Dr
- 4923 S 525 W
- 4952 S 525 W
- 4905 S 525 W
- 524 W 4900 S
- 4969 S Ridgeline Dr
- 4960 S Ridgeline Dr