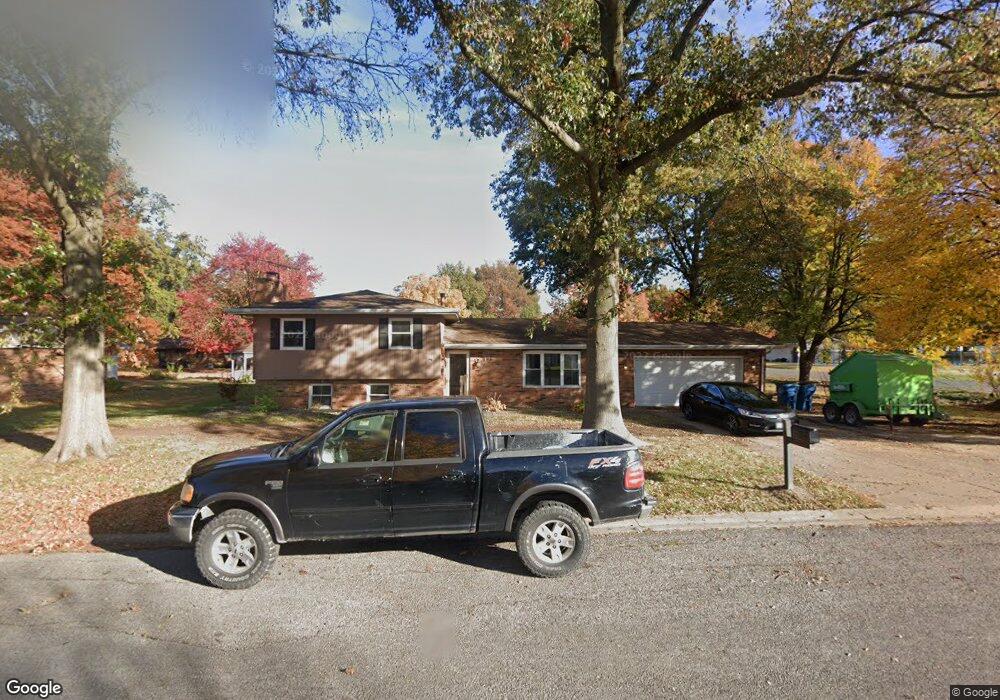
493 E 2nd St Trenton, IL 62293
Estimated Value: $232,000 - $278,000
--
Bed
--
Bath
2,136
Sq Ft
$116/Sq Ft
Est. Value
About This Home
This home is located at 493 E 2nd St, Trenton, IL 62293 and is currently estimated at $247,673, approximately $115 per square foot. 493 E 2nd St is a home located in Clinton County with nearby schools including Wesclin Middle School and Wesclin Sr High School.
Ownership History
Date
Name
Owned For
Owner Type
Purchase Details
Closed on
Jun 9, 2021
Sold by
Green Jason P and Green Kristie L
Bought by
Green Jason P
Current Estimated Value
Home Financials for this Owner
Home Financials are based on the most recent Mortgage that was taken out on this home.
Original Mortgage
$139,825
Outstanding Balance
$126,295
Interest Rate
2.75%
Mortgage Type
FHA
Estimated Equity
$121,378
Purchase Details
Closed on
Aug 15, 2007
Sold by
Wilkerson Susan A
Bought by
Green Jason P and Green Kristie L
Home Financials for this Owner
Home Financials are based on the most recent Mortgage that was taken out on this home.
Original Mortgage
$139,000
Interest Rate
6.79%
Mortgage Type
New Conventional
Purchase Details
Closed on
Jul 5, 2006
Sold by
Misiewiez Welsey T
Bought by
Misiewiez Welsley T and Wujesib Susan A
Create a Home Valuation Report for This Property
The Home Valuation Report is an in-depth analysis detailing your home's value as well as a comparison with similar homes in the area
Home Values in the Area
Average Home Value in this Area
Purchase History
| Date | Buyer | Sale Price | Title Company |
|---|---|---|---|
| Green Jason P | -- | None Available | |
| Green Jason P | $139,000 | None Available | |
| Misiewiez Welsley T | -- | None Available |
Source: Public Records
Mortgage History
| Date | Status | Borrower | Loan Amount |
|---|---|---|---|
| Open | Green Jason P | $139,825 | |
| Closed | Green Jason P | $139,000 |
Source: Public Records
Tax History Compared to Growth
Tax History
| Year | Tax Paid | Tax Assessment Tax Assessment Total Assessment is a certain percentage of the fair market value that is determined by local assessors to be the total taxable value of land and additions on the property. | Land | Improvement |
|---|---|---|---|---|
| 2024 | $4,449 | $66,370 | $13,550 | $52,820 |
| 2023 | $4,449 | $62,610 | $12,780 | $49,830 |
| 2022 | $4,299 | $64,390 | $13,440 | $50,950 |
| 2021 | $4,041 | $61,320 | $12,800 | $48,520 |
| 2020 | $3,966 | $58,960 | $12,310 | $46,650 |
| 2019 | $3,931 | $58,960 | $12,310 | $46,650 |
| 2018 | $3,930 | $56,155 | $12,926 | $43,229 |
| 2017 | $3,613 | $53,480 | $12,310 | $41,170 |
| 2016 | $3,578 | $53,480 | $12,310 | $41,170 |
Source: Public Records
Map
Nearby Homes
- 311 E 3rd St
- 437 Galen Dr
- 679 Galen Dr
- 501 Wedgewood Ln
- 1144 Emily Ln
- 525 Wedgewood Ln
- 416 N Main St
- 607 Wedgewood Ln
- 203 S Walnut St
- 619 Wedgewood Ln
- 630 Wedgewood Ln
- 20 E Kentucky St
- 122 W 1st St
- 304 S Washington St
- 220 N Madison St
- 503 N Creek Crossing
- 413 W Broadway
- 12746 Rolling Hills Dr
- 3265 Venhaus Rd
- 3221 Venhaus Rd