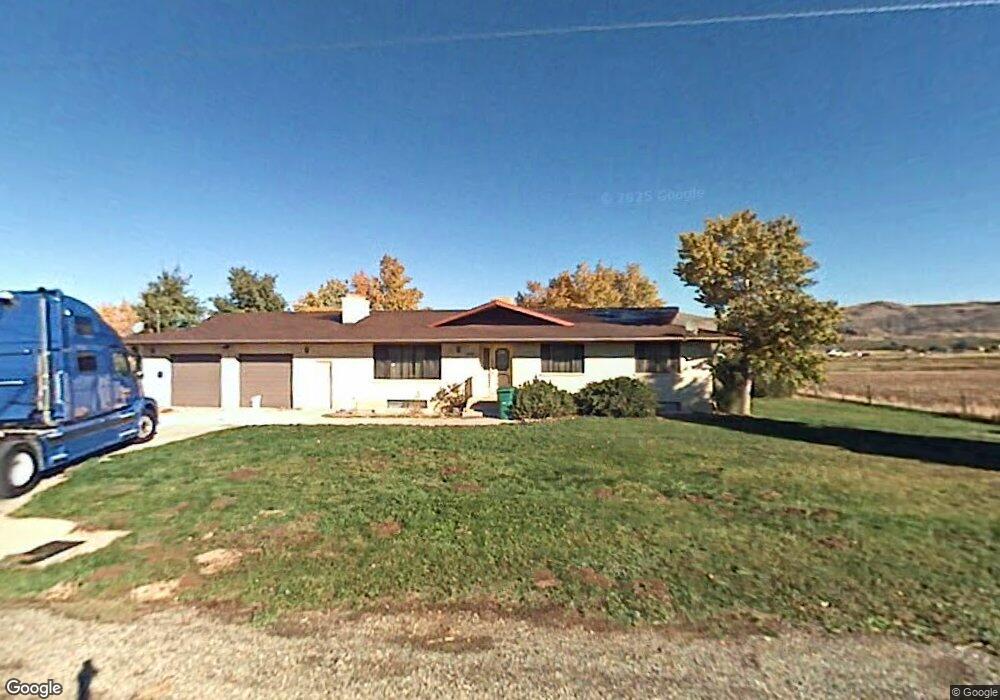
493 E 400 N Genola, UT 84655
Estimated Value: $789,000 - $980,000
5
Beds
3
Baths
3,208
Sq Ft
$263/Sq Ft
Est. Value
About This Home
This home is located at 493 E 400 N, Genola, UT 84655 and is currently estimated at $844,567, approximately $263 per square foot. 493 E 400 N is a home located in Utah County with nearby schools including Goshen Elementary school, Payson Junior High School, and Mt. Nebo Middle.
Ownership History
Date
Name
Owned For
Owner Type
Purchase Details
Closed on
Jul 9, 2021
Sold by
Okelberry Valina K
Bought by
Okelberry Valina K and Valina K Okelberry Family Livi
Current Estimated Value
Purchase Details
Closed on
Aug 12, 2015
Sold by
Kennedy Joseph E
Bought by
Okelberry Valina K
Home Financials for this Owner
Home Financials are based on the most recent Mortgage that was taken out on this home.
Original Mortgage
$251,250
Outstanding Balance
$197,741
Interest Rate
4.05%
Mortgage Type
New Conventional
Estimated Equity
$646,826
Purchase Details
Closed on
Feb 20, 2015
Sold by
Jolley Patrick R
Bought by
Kennedy Joseph Ee
Purchase Details
Closed on
Sep 29, 2008
Sold by
Kaser Nancy Louise and Jolley Patrick R
Bought by
Jolley Patrick R
Create a Home Valuation Report for This Property
The Home Valuation Report is an in-depth analysis detailing your home's value as well as a comparison with similar homes in the area
Purchase History
We collect this data history from publicly available records. To have your information removed, we recommend requesting removal directly through your county’s website.
| Date | Buyer | Sale Price | Title Company |
|---|---|---|---|
| Okelberry Valina K | -- | None Available | |
| Okelberry Valina K | -- | Provo Land Title Co | |
| Kennedy Joseph Ee | -- | Provo Land Title Co | |
| Jolley Patrick R | -- | None Available |
Source: Public Records
Mortgage History
We collect this data history from publicly available records. To have your information removed, we recommend requesting removal directly through your county’s website.
| Date | Status | Borrower | Loan Amount |
|---|---|---|---|
| Open | Okelberry Valina K | $251,250 |
Source: Public Records
Tax History
| Year | Tax Paid | Tax Assessment Tax Assessment Total Assessment is a certain percentage of the fair market value that is determined by local assessors to be the total taxable value of land and additions on the property. | Land | Improvement |
|---|---|---|---|---|
| 2025 | $649 | $363,245 | -- | -- |
| 2024 | $649 | $319,480 | $0 | $0 |
| 2023 | $3,046 | $315,575 | $0 | $0 |
| 2022 | $2,982 | $525,700 | $272,200 | $253,500 |
| 2021 | $2,559 | $395,600 | $188,000 | $207,600 |
| 2020 | $2,425 | $365,100 | $163,500 | $201,600 |
| 2019 | $2,080 | $321,500 | $140,900 | $180,600 |
| 2018 | $1,915 | $282,900 | $125,900 | $157,000 |
| 2017 | $1,787 | $152,555 | $0 | $0 |
| 2016 | $1,491 | $127,970 | $0 | $0 |
Source: Public Records
Map
Nearby Homes
- 956 N Main St
- 718 S State St
- 975 E 715 S
- 115 E 1600 N
- 444 S 600 West St
- 70 W 1790 N
- 1010 S Anna Ekins Memorial Ln
- 907 N 260 E
- 892 N 260 E
- 875 N 260 E
- 893 N 260 W Unit 227
- 892 N 260 W Unit 202
- 11508 S 5825 W
- 332 Red Rock Dr
- 684 Empress St Unit 20
- 682 Empress St Unit 21
- 210 W 930 N
- 206 W 930 N
- 678 Empress St Unit 22
- 678 W Empress St
Your Personal Tour Guide
Ask me questions while you tour the home.