493 Ferling Ct Waterford, MI 48327
Waterford Township NeighborhoodEstimated Value: $396,000 - $462,000
3
Beds
3
Baths
2,159
Sq Ft
$196/Sq Ft
Est. Value
About This Home
This home is located at 493 Ferling Ct, Waterford, MI 48327 and is currently estimated at $423,636, approximately $196 per square foot. 493 Ferling Ct is a home located in Oakland County with nearby schools including Pierce Middle School, Waterford Kettering High School, and Lakecrest Baptist School.
Ownership History
Date
Name
Owned For
Owner Type
Purchase Details
Closed on
Aug 17, 2018
Sold by
Morrow Christopher and Morrow Linsa S
Bought by
Morrow Scott E and Morrow Sandra K
Current Estimated Value
Home Financials for this Owner
Home Financials are based on the most recent Mortgage that was taken out on this home.
Original Mortgage
$135,000
Outstanding Balance
$82,409
Interest Rate
4.5%
Mortgage Type
New Conventional
Estimated Equity
$341,227
Purchase Details
Closed on
Apr 6, 1999
Sold by
Jfk Investment Co
Bought by
Nathan Bernard Inc
Create a Home Valuation Report for This Property
The Home Valuation Report is an in-depth analysis detailing your home's value as well as a comparison with similar homes in the area
Home Values in the Area
Average Home Value in this Area
Purchase History
| Date | Buyer | Sale Price | Title Company |
|---|---|---|---|
| Morrow Scott E | $250,000 | None Available | |
| Nathan Bernard Inc | $34,500 | -- |
Source: Public Records
Mortgage History
| Date | Status | Borrower | Loan Amount |
|---|---|---|---|
| Open | Morrow Scott E | $135,000 |
Source: Public Records
Tax History Compared to Growth
Tax History
| Year | Tax Paid | Tax Assessment Tax Assessment Total Assessment is a certain percentage of the fair market value that is determined by local assessors to be the total taxable value of land and additions on the property. | Land | Improvement |
|---|---|---|---|---|
| 2024 | $2,139 | $172,280 | $0 | $0 |
| 2023 | $2,041 | $150,340 | $0 | $0 |
| 2022 | $3,287 | $138,410 | $0 | $0 |
| 2021 | $3,107 | $137,260 | $0 | $0 |
| 2020 | $1,868 | $138,180 | $0 | $0 |
| 2019 | $3,037 | $130,040 | $0 | $0 |
| 2018 | $3,068 | $108,540 | $0 | $0 |
| 2017 | $2,820 | $108,540 | $0 | $0 |
| 2016 | $2,815 | $112,100 | $0 | $0 |
| 2015 | -- | $107,760 | $0 | $0 |
| 2014 | -- | $96,550 | $0 | $0 |
| 2011 | -- | $77,610 | $0 | $0 |
Source: Public Records
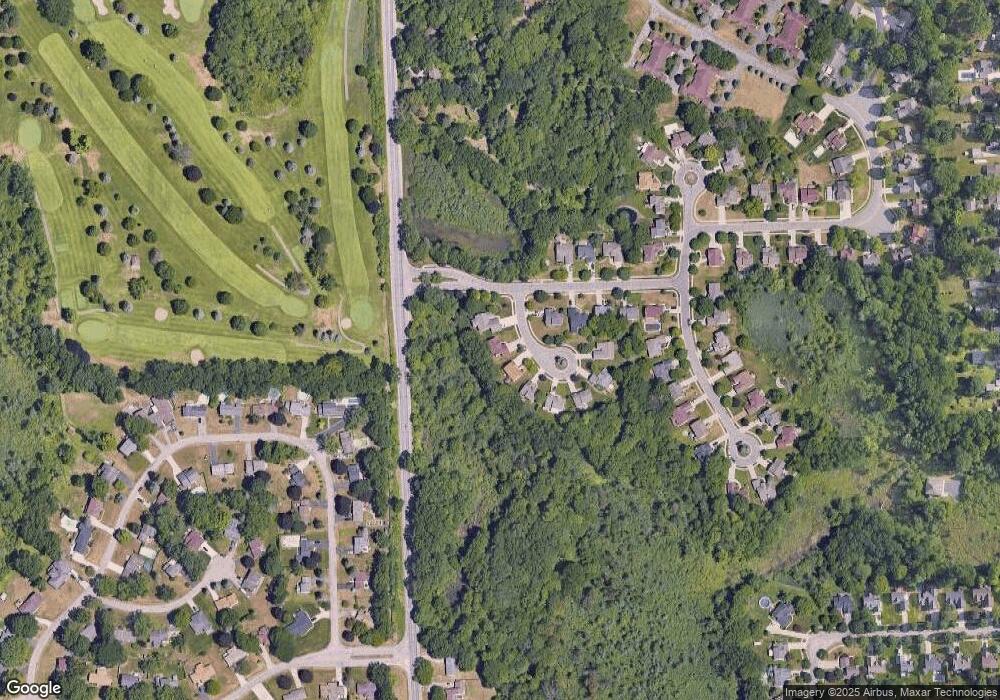
Map
Nearby Homes
- 8162 Rene Dr
- 837 Hidden Terrace
- 0000 Daffodil Dr
- 180 Pine Tree Ridge Dr Unit 3
- 7825 Elizabeth Lake Rd
- 319 Pine Creek Ct Unit 15
- 00 Fox Bay Dr
- 7342 Elizabeth Lake Rd
- 229 Summit Ridge
- 8363 Capstone Dr
- 121 Allen Lake Dr
- 165 Lisa Ct
- 193 Coppice Way
- 8341 Sharon Dr
- 7014 Marco Dr
- 8650 Sandy Crest Dr
- 000 Sandycrest Dr
- 0000 Williams Lake Rd
- 8637 Brazos Ct
- 9062 Rhyan Rd
- 479 Ferling Ct
- 507 Ferling Ct
- 465 Ferling Ct
- 7983 W Oakland Manor Dr
- 453 Ferling Ct
- 7971 W Oakland Manor Dr
- 450 Ferling Ct
- 486 Ferling Ct
- 7959 W Oakland Manor Dr
- 7980 W Oakland Manor Dr Unit 1
- 468 Ferling Ct
- 7947 W Oakland Manor Dr
- 7968 W Oakland Manor Dr
- 7956 W Oakland Manor Dr
- 491 Salus Dr
- 8070 Rene Dr
- 8058 Rene Dr
- 7935 W Oakland Manor Dr Unit 52
- 473 Salus Dr
- 455 Salus Dr Unit 49