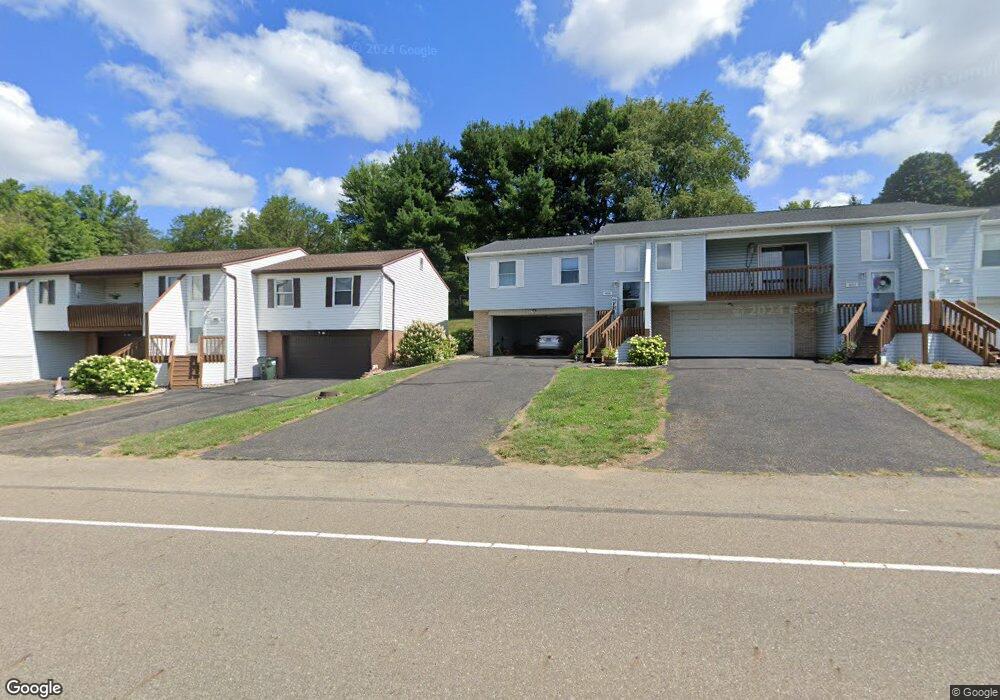
493 N Orchard Rd NE Unit 493 Bolivar, OH 44612
Estimated Value: $310,000 - $789,000
6
Beds
3
Baths
2,576
Sq Ft
$222/Sq Ft
Est. Value
About This Home
This home is located at 493 N Orchard Rd NE Unit 493, Bolivar, OH 44612 and is currently estimated at $570,987, approximately $221 per square foot. 493 N Orchard Rd NE Unit 493 is a home located in Tuscarawas County with nearby schools including Tuscarawas Valley Primary School, Tuscarawas Valley Intermediate School, and Tuscarawas Valley Middle School.
Ownership History
Date
Name
Owned For
Owner Type
Purchase Details
Closed on
Dec 1, 2014
Sold by
Bichara Kamal F and Bichara Mona S
Bought by
Rrc Holdings Llc
Current Estimated Value
Home Financials for this Owner
Home Financials are based on the most recent Mortgage that was taken out on this home.
Original Mortgage
$310,000
Interest Rate
3.91%
Purchase Details
Closed on
Feb 17, 2005
Sold by
Bichara Mona S
Bought by
Bichara Kamal F and Bichara Mona S
Purchase Details
Closed on
Jan 19, 2005
Sold by
Bichara Kamal F
Bought by
Bichara Mona S
Purchase Details
Closed on
Jun 2, 1994
Sold by
Maltese N D
Bought by
Bichara Kamal and Bichara Mona S
Home Financials for this Owner
Home Financials are based on the most recent Mortgage that was taken out on this home.
Original Mortgage
$226,400
Interest Rate
7%
Mortgage Type
Commercial
Purchase Details
Closed on
Dec 24, 1987
Bought by
Bichara Kamal F and Bichara Mona S
Create a Home Valuation Report for This Property
The Home Valuation Report is an in-depth analysis detailing your home's value as well as a comparison with similar homes in the area
Home Values in the Area
Average Home Value in this Area
Purchase History
| Date | Buyer | Sale Price | Title Company |
|---|---|---|---|
| Rrc Holdings Llc | -- | Exclusive Title | |
| Bichara Kamal F | -- | -- | |
| Bichara Mona S | -- | -- | |
| Bichara Kamal | $283,000 | -- | |
| Bichara Kamal F | $250,000 | -- |
Source: Public Records
Mortgage History
| Date | Status | Borrower | Loan Amount |
|---|---|---|---|
| Closed | Rrc Holdings Llc | $310,000 | |
| Closed | Bichara Kamal | $226,400 |
Source: Public Records
Tax History Compared to Growth
Tax History
| Year | Tax Paid | Tax Assessment Tax Assessment Total Assessment is a certain percentage of the fair market value that is determined by local assessors to be the total taxable value of land and additions on the property. | Land | Improvement |
|---|---|---|---|---|
| 2024 | -- | $0 | $0 | $0 |
| 2023 | -- | $0 | $0 | $0 |
| 2022 | $0 | $0 | $0 | $0 |
| 2021 | $0 | $0 | $0 | $0 |
| 2020 | $0 | $0 | $0 | $0 |
| 2019 | $2,887 | $59,980 | $8,036 | $51,944 |
| 2018 | $2,934 | $57,340 | $7,680 | $49,660 |
| 2017 | $4,987 | $57,340 | $7,680 | $49,660 |
| 2016 | $2,930 | $57,340 | $7,680 | $49,660 |
| 2014 | $7,098 | $115,030 | $7,810 | $107,220 |
| 2013 | $5,970 | $115,030 | $7,810 | $107,220 |
Source: Public Records
Map
Nearby Homes
- 379 Olde Orchard Dr NE
- 10988 Madlyn St NE
- 10952 Madlyn St NE
- 11275 Indian Hills Dr NE
- 10884 Madlyn St NE
- 827 Melissa St NE
- 720 Holly St NE
- 797 Glenda St NE
- 0 Kerns Dr NE
- 224 Yant St
- 12239 Sherman Church Rd NE
- 11162 Northwood Ave NE
- 1517 NE North Orchard Rd
- 10419 Laurens Dr NE
- 11167 Northwood Ave NE
- 11121 Northwood Ave NE
- 1557 N Orchard Rd NE
- 0 State Route 212 Unit 4441887
- 1678 N Orchard Rd NE
- 10784 Fisher Rd NW
- 493 NE North Orchard Rd
- 511 N Orchard Rd NE
- 525 N Orchard Rd NE
- 396 Olde Orchard Dr NE
- 416 Olde Orchard Dr NE
- 376 Olde Orchard Dr NE
- 470 N Orchard Rd NE
- 438 Olde Orchard Dr NE
- 349 Olde Orchard Dr NE
- 343 Olde Orchard Dr NE
- 355 Olde Orchard Dr NE
- 367 Olde Orchard Dr NE
- 361 Olde Orchard Dr NE
- 342 Olde Orchard Dr NE
- 551 N Orchard Rd NE
- 373 Olde Orchard Dr NE
- 11142 Greenbrier Dr NE
- 460 Olde Orchard Dr NE
- 441 N Orchard Rd NE Unit A
- 441 NE North Orchard Rd