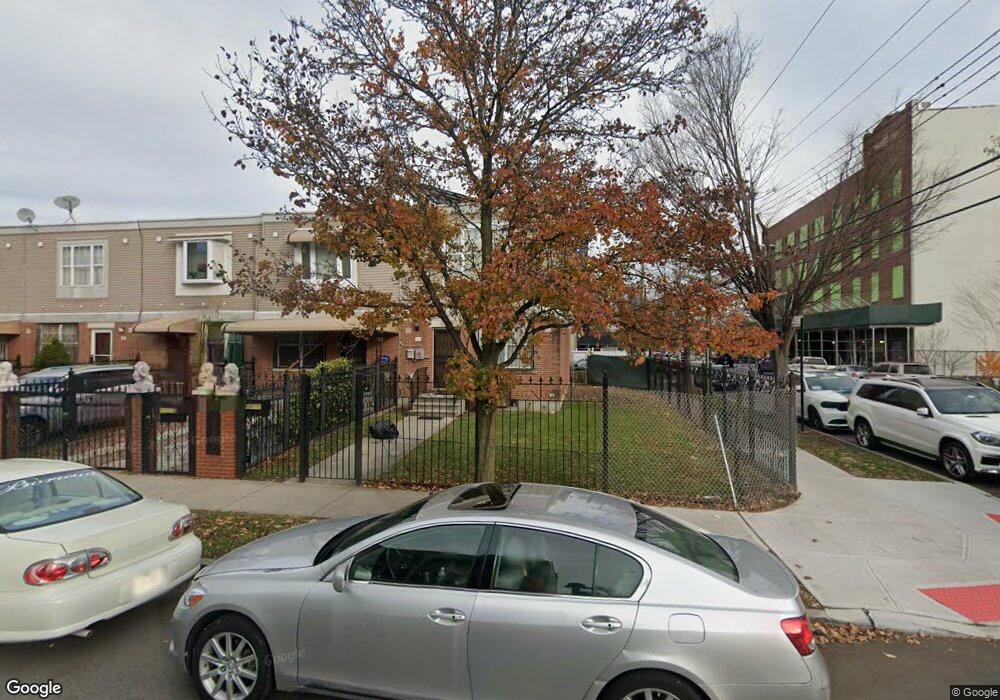
493 Osborn St Brooklyn, NY 11212
Brownsville NeighborhoodEstimated Value: $578,259 - $736,000
--
Bed
--
Bath
1,260
Sq Ft
$498/Sq Ft
Est. Value
About This Home
This home is located at 493 Osborn St, Brooklyn, NY 11212 and is currently estimated at $627,565, approximately $498 per square foot. 493 Osborn St is a home located in Kings County with nearby schools including P.S. 165 Ida Posner, P.S. 150 - Christopher, and P.S. 156 Waverly.
Ownership History
Date
Name
Owned For
Owner Type
Purchase Details
Closed on
Oct 29, 2003
Sold by
Nehemiah Housing Develoment Fund Company
Bought by
Hutchinson Sharmin C
Current Estimated Value
Home Financials for this Owner
Home Financials are based on the most recent Mortgage that was taken out on this home.
Original Mortgage
$88,000
Interest Rate
5.89%
Mortgage Type
Purchase Money Mortgage
Create a Home Valuation Report for This Property
The Home Valuation Report is an in-depth analysis detailing your home's value as well as a comparison with similar homes in the area
Home Values in the Area
Average Home Value in this Area
Purchase History
| Date | Buyer | Sale Price | Title Company |
|---|---|---|---|
| Hutchinson Sharmin C | $113,000 | -- |
Source: Public Records
Mortgage History
| Date | Status | Borrower | Loan Amount |
|---|---|---|---|
| Previous Owner | Hutchinson Sharmin C | $88,000 | |
| Closed | Hutchinson Sharmin C | $20,000 |
Source: Public Records
Tax History Compared to Growth
Tax History
| Year | Tax Paid | Tax Assessment Tax Assessment Total Assessment is a certain percentage of the fair market value that is determined by local assessors to be the total taxable value of land and additions on the property. | Land | Improvement |
|---|---|---|---|---|
| 2025 | $4,056 | $37,440 | $17,280 | $20,160 |
| 2024 | $4,056 | $44,040 | $17,280 | $26,760 |
| 2023 | $2,249 | $45,240 | $17,280 | $27,960 |
| 2022 | $1,625 | $40,680 | $17,280 | $23,400 |
| 2021 | $1,631 | $31,680 | $17,280 | $14,400 |
| 2020 | $2,564 | $29,160 | $17,280 | $11,880 |
| 2019 | $2,370 | $26,100 | $17,280 | $8,820 |
| 2018 | $1,807 | $20,763 | $9,163 | $11,600 |
| 2017 | $1,329 | $19,588 | $7,988 | $11,600 |
| 2016 | $1,065 | $18,480 | $6,880 | $11,600 |
| 2015 | $538 | $20,826 | $6,880 | $13,946 |
| 2014 | $538 | $19,648 | $5,702 | $13,946 |
Source: Public Records
Map
Nearby Homes
- 797 Mother Gaston Blvd
- 258 Lott Ave
- 699 Sackman St
- 546 Powell St
- 587 Osborn St
- 504 Thatford Ave
- 524 Chester St
- 555 Christopher Ave
- 578 Christopher Ave
- 563 Powell St
- 923 Rockaway Ave
- 124 Lott Ave
- 632 Osborn St
- 546 Bristol St
- 892 Mother Gaston Blvd
- 931 Thomas S Boyland St
- 385 Amboy St
- 121 Riverdale Ave
- 664 Osborn St Unit 1
- 363 Amboy St