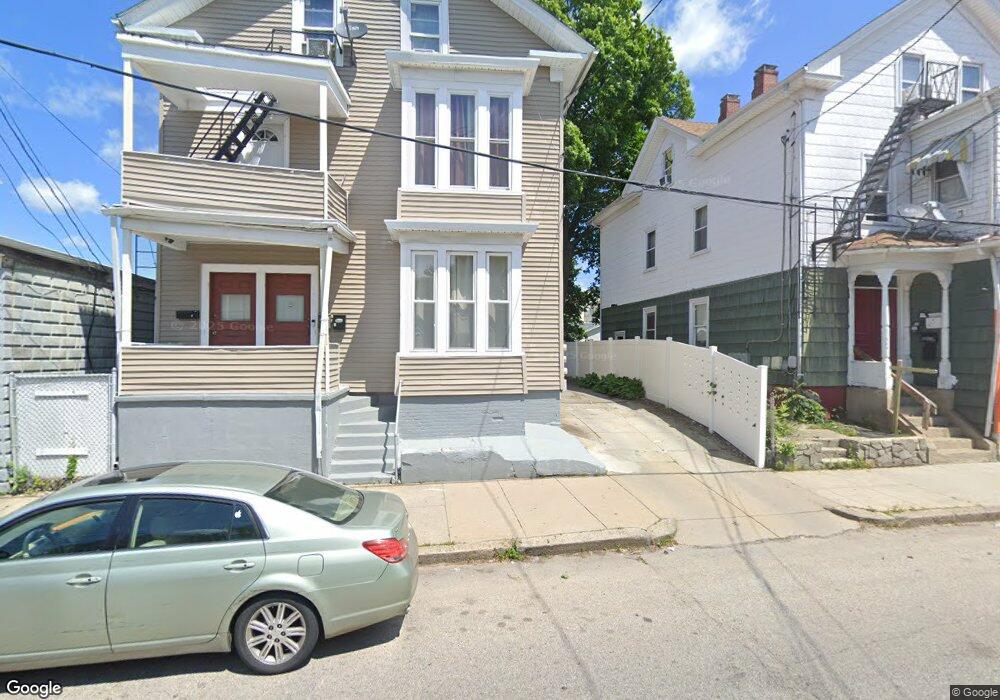
493 Plainfield St Providence, RI 02909
Silver Lake NeighborhoodEstimated Value: $287,096 - $592,000
8
Beds
3
Baths
2,772
Sq Ft
$185/Sq Ft
Est. Value
About This Home
This home is located at 493 Plainfield St, Providence, RI 02909 and is currently estimated at $511,774, approximately $184 per square foot. 493 Plainfield St is a home located in Providence County with nearby schools including Charles N. Fortes Elementary School, Asa Messer Elementary School, and Laurel Hill Annex School.
Ownership History
Date
Name
Owned For
Owner Type
Purchase Details
Closed on
Mar 31, 2014
Sold by
Disla Fermin
Bought by
Disla Fermin and Disla Jordan
Current Estimated Value
Home Financials for this Owner
Home Financials are based on the most recent Mortgage that was taken out on this home.
Original Mortgage
$116,250
Outstanding Balance
$87,879
Interest Rate
4.27%
Estimated Equity
$423,895
Purchase Details
Closed on
Sep 14, 2011
Sold by
Disla Fermin and Garcia Bernarda
Bought by
Disla Fermin
Purchase Details
Closed on
Jan 20, 2010
Sold by
Rgp Group Llc
Bought by
Disla Fermin and Garcia Bernarda
Home Financials for this Owner
Home Financials are based on the most recent Mortgage that was taken out on this home.
Original Mortgage
$117,826
Interest Rate
4.79%
Mortgage Type
Purchase Money Mortgage
Purchase Details
Closed on
Dec 19, 2008
Sold by
Equivest Llc
Bought by
Rgp Group Llc
Purchase Details
Closed on
Dec 10, 2008
Sold by
Balloi Marco and Guzman Disnalda A
Bought by
Equivest Llc
Purchase Details
Closed on
Dec 1, 2003
Sold by
Guerrero Carlos M
Bought by
Guzman Disnalda A and Baldi Marco G
Home Financials for this Owner
Home Financials are based on the most recent Mortgage that was taken out on this home.
Original Mortgage
$213,155
Interest Rate
6.09%
Mortgage Type
Purchase Money Mortgage
Create a Home Valuation Report for This Property
The Home Valuation Report is an in-depth analysis detailing your home's value as well as a comparison with similar homes in the area
Home Values in the Area
Average Home Value in this Area
Purchase History
| Date | Buyer | Sale Price | Title Company |
|---|---|---|---|
| Disla Fermin | -- | -- | |
| Disla Fermin | -- | -- | |
| Disla Fermin | $120,000 | -- | |
| Rgp Group Llc | $83,500 | -- | |
| Equivest Llc | $41,699 | -- | |
| Guzman Disnalda A | $216,500 | -- |
Source: Public Records
Mortgage History
| Date | Status | Borrower | Loan Amount |
|---|---|---|---|
| Open | Disla Fermin | $116,250 | |
| Previous Owner | Guzman Disnalda A | $117,826 | |
| Previous Owner | Guzman Disnalda A | $297,000 | |
| Previous Owner | Guzman Disnalda A | $213,155 |
Source: Public Records
Tax History Compared to Growth
Tax History
| Year | Tax Paid | Tax Assessment Tax Assessment Total Assessment is a certain percentage of the fair market value that is determined by local assessors to be the total taxable value of land and additions on the property. | Land | Improvement |
|---|---|---|---|---|
| 2025 | $7,097 | $506,900 | $128,000 | $378,900 |
| 2024 | $5,509 | $300,200 | $72,000 | $228,200 |
| 2023 | $5,509 | $300,200 | $72,000 | $228,200 |
| 2022 | $5,344 | $300,200 | $72,000 | $228,200 |
| 2021 | $4,288 | $174,600 | $45,700 | $128,900 |
| 2020 | $4,288 | $174,600 | $45,700 | $128,900 |
| 2019 | $4,288 | $174,600 | $45,700 | $128,900 |
| 2018 | $3,500 | $109,500 | $44,300 | $65,200 |
| 2017 | $3,500 | $109,500 | $44,300 | $65,200 |
| 2016 | $3,500 | $109,500 | $44,300 | $65,200 |
| 2015 | $3,247 | $98,100 | $47,100 | $51,000 |
| 2014 | $3,311 | $98,100 | $47,100 | $51,000 |
| 2013 | $3,311 | $98,100 | $47,100 | $51,000 |
Source: Public Records
Map
Nearby Homes
- 64 Ralph St
- 663 Plainfield St
- 20 Dewey St
- 240 Eastwood Ave
- 47 Alverson Ave
- 122 Laban St
- 144 Daniel Ave
- 29 Dunford St
- 78 Whittier Ave
- 231 Lowell Ave
- 62 Heath St
- 20 Magdalene St
- 665 Plainfield St
- 236 Lowell Ave
- 41 Terrace Ave
- 50 Laban St
- 18 Crowninshield St
- 22 Bancroft St
- 27 Moorefield St
- 36 Moorefield St Unit 38
- 489 Plainfield St
- 497 Plainfield St
- 501 Plainfield St
- 200 Whittier Ave
- 196 Whittier Ave
- 500 Plainfield St
- 485 Plainfield St
- 498 Plainfield St
- 494 Plainfield St
- 140 Laurel Hill Ave
- 488 Plainfield St
- 502 Plainfield St
- 484 Plainfield St
- 508 Plainfield St
- 510 Plainfield St
- 515 Plainfield St
- 515 Plainfield St Unit 2
- 515 Plainfield St Unit 1
- 168 Laurel Hill Ave
- 139 Laurel Hill Ave