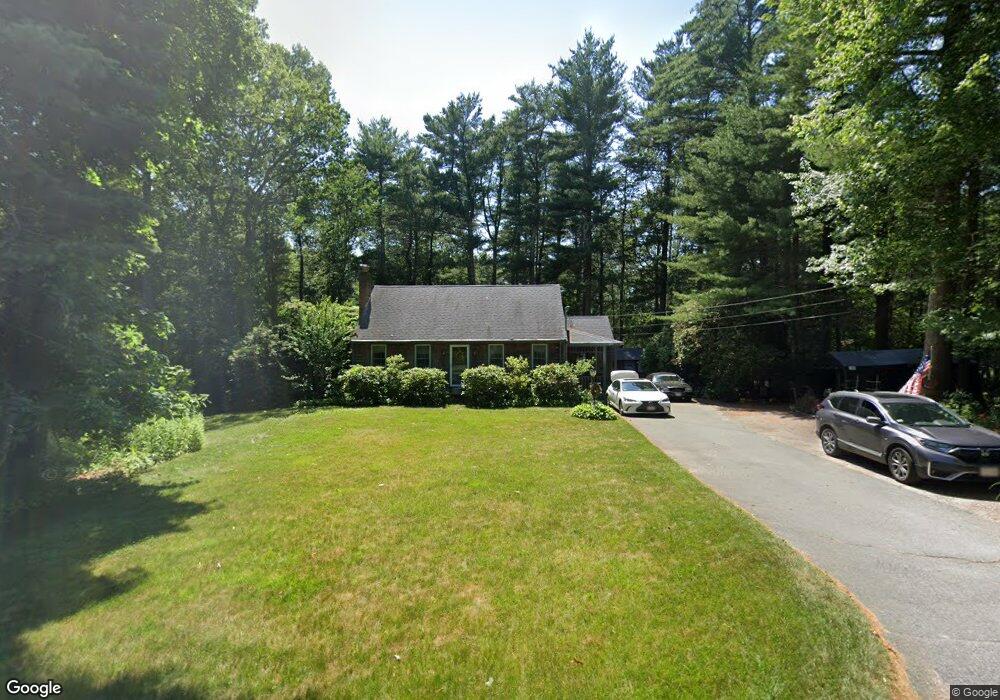
493 Walnut St Bridgewater, MA 02324
Estimated Value: $525,000 - $694,000
3
Beds
2
Baths
1,547
Sq Ft
$387/Sq Ft
Est. Value
About This Home
This home is located at 493 Walnut St, Bridgewater, MA 02324 and is currently estimated at $598,369, approximately $386 per square foot. 493 Walnut St is a home located in Plymouth County with nearby schools including Mitchell Elementary School, Williams Intermediate School, and Bridgewater Middle School.
Ownership History
Date
Name
Owned For
Owner Type
Purchase Details
Closed on
Dec 30, 1994
Sold by
Mcconnell Stephen J and Mcconnell Cynthia M
Bought by
Howard Michael L and Howard Nanette M
Current Estimated Value
Home Financials for this Owner
Home Financials are based on the most recent Mortgage that was taken out on this home.
Original Mortgage
$111,900
Interest Rate
9.2%
Mortgage Type
Purchase Money Mortgage
Create a Home Valuation Report for This Property
The Home Valuation Report is an in-depth analysis detailing your home's value as well as a comparison with similar homes in the area
Home Values in the Area
Average Home Value in this Area
Purchase History
| Date | Buyer | Sale Price | Title Company |
|---|---|---|---|
| Howard Michael L | $139,900 | -- |
Source: Public Records
Mortgage History
| Date | Status | Borrower | Loan Amount |
|---|---|---|---|
| Closed | Howard Michael L | $111,900 | |
| Previous Owner | Howard Michael L | $10,000 |
Source: Public Records
Tax History
| Year | Tax Paid | Tax Assessment Tax Assessment Total Assessment is a certain percentage of the fair market value that is determined by local assessors to be the total taxable value of land and additions on the property. | Land | Improvement |
|---|---|---|---|---|
| 2025 | $5,781 | $488,700 | $191,900 | $296,800 |
| 2024 | $5,620 | $462,900 | $182,700 | $280,200 |
| 2023 | $5,632 | $438,600 | $170,700 | $267,900 |
| 2022 | $5,560 | $388,300 | $149,800 | $238,500 |
| 2021 | $5,023 | $346,900 | $133,800 | $213,100 |
| 2020 | $4,917 | $333,800 | $128,600 | $205,200 |
| 2019 | $4,846 | $326,800 | $128,600 | $198,200 |
| 2018 | $77,400 | $297,700 | $118,700 | $179,000 |
| 2017 | $4,352 | $278,800 | $118,700 | $160,100 |
| 2016 | $4,168 | $268,200 | $116,300 | $151,900 |
| 2015 | $4,166 | $256,500 | $112,900 | $143,600 |
| 2014 | $3,955 | $243,400 | $103,800 | $139,600 |
Source: Public Records
Map
Nearby Homes
- 199 Cherry St
- 211 Cherry St
- 0 Auburn St
- 3 Caswell Way
- 829 Auburn St
- 425 Laurel St
- 73 Pratt Ave
- 44 Titicut Ave Unit Lot 45
- 40 Titicut Ave Unit Lot 46
- 48 Titicut Ave
- 17 Forbes Rd Unit Lot 64
- 37 Titicut Ave Unit Lot 34
- 81 Pratt Ave
- 150 Prattown Ln
- 0 Flagg St Unit 73421818
- 74 Magnolia Way
- Lot 1 Mill St
- 35 Nelson Dr
- 225 Whitman St
- 215 Whitman St
Your Personal Tour Guide
Ask me questions while you tour the home.