Estimated Value: $290,216 - $311,000
--
Bed
3
Baths
1,865
Sq Ft
$160/Sq Ft
Est. Value
About This Home
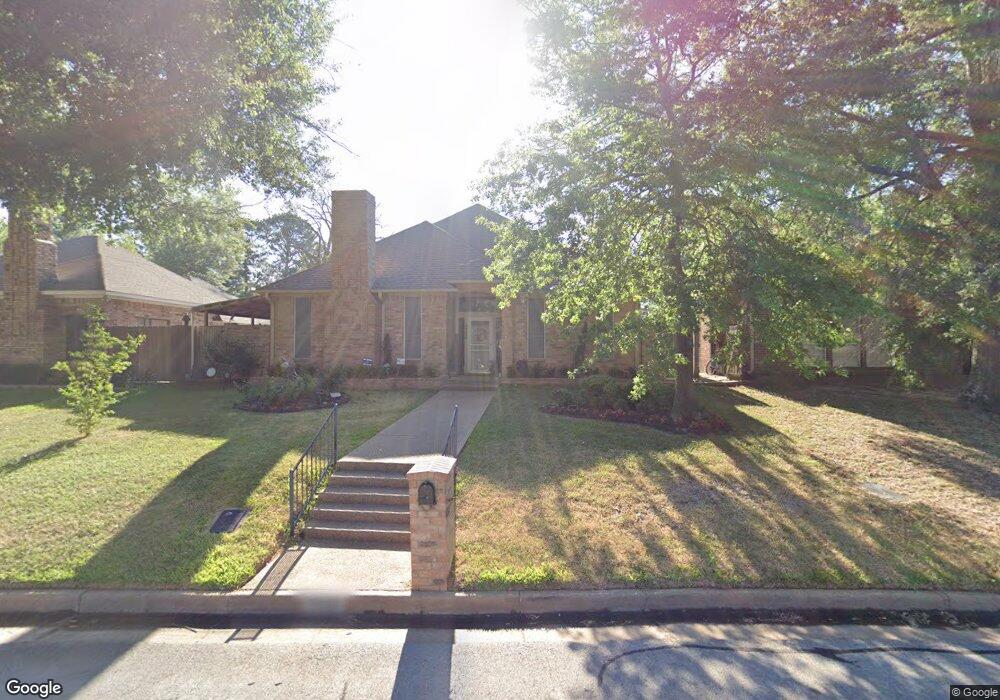
This home is located at 4930 Forestwood Blvd, Tyler, TX 75703 and is currently estimated at $299,304, approximately $160 per square foot. 4930 Forestwood Blvd is a home located in Smith County with nearby schools including Rice Elementary School, Hubbard Middle School, and Tyler Legacy High School.
Ownership History
Date
Name
Owned For
Owner Type
Purchase Details
Closed on
Jan 17, 2025
Sold by
Bates Katherine Elaine
Bought by
Bates Katherine Elaine and Katherine Elaine Bates Irrevocable Trust
Current Estimated Value
Purchase Details
Closed on
Jan 28, 2024
Sold by
Bates Freddy Lee and Bates Katherine Elaine
Bought by
Bates Katherine Elaine
Purchase Details
Closed on
Feb 25, 2010
Sold by
Williamson Wayne E and Williamson Jessie P
Bought by
Bates Freddy Lee and Bates Katherine Elaine
Home Financials for this Owner
Home Financials are based on the most recent Mortgage that was taken out on this home.
Original Mortgage
$120,000
Interest Rate
5.05%
Mortgage Type
New Conventional
Purchase Details
Closed on
Oct 20, 2008
Sold by
Caldwell Martha Gail
Bought by
Williamson Wayne E and Williamson Jessie P
Create a Home Valuation Report for This Property
The Home Valuation Report is an in-depth analysis detailing your home's value as well as a comparison with similar homes in the area
Home Values in the Area
Average Home Value in this Area
Purchase History
| Date | Buyer | Sale Price | Title Company |
|---|---|---|---|
| Bates Katherine Elaine | -- | None Listed On Document | |
| Bates Katherine Elaine | -- | None Listed On Document | |
| Bates Freddy Lee | -- | Homeland Title Company | |
| Williamson Wayne E | -- | None Available |
Source: Public Records
Mortgage History
| Date | Status | Borrower | Loan Amount |
|---|---|---|---|
| Previous Owner | Bates Freddy Lee | $120,000 |
Source: Public Records
Tax History Compared to Growth
Tax History
| Year | Tax Paid | Tax Assessment Tax Assessment Total Assessment is a certain percentage of the fair market value that is determined by local assessors to be the total taxable value of land and additions on the property. | Land | Improvement |
|---|---|---|---|---|
| 2025 | $1,021 | $255,147 | $29,013 | $226,134 |
| 2024 | $1,021 | $261,020 | $40,000 | $244,129 |
| 2023 | $4,136 | $268,449 | $40,000 | $228,449 |
| 2022 | $4,226 | $215,719 | $32,960 | $182,759 |
| 2021 | $4,339 | $212,676 | $32,960 | $179,716 |
| 2020 | $4,023 | $205,711 | $32,960 | $172,751 |
| 2019 | $3,738 | $170,930 | $32,000 | $138,930 |
| 2018 | $3,498 | $160,817 | $32,000 | $128,817 |
| 2017 | $3,433 | $160,817 | $32,000 | $128,817 |
| 2016 | $3,390 | $158,778 | $32,000 | $126,778 |
| 2015 | $2,480 | $153,449 | $32,000 | $121,449 |
| 2014 | $2,480 | $148,351 | $32,000 | $116,351 |
Source: Public Records
Map
Nearby Homes
- 7434 Waterview Square
- 6052 N Park Central Ct
- 704 Paloma St
- 601 Carriage Dr
- 5106 Cloverdale Dr
- 418 Boyd Ln
- 429 Holiday Ln
- 802 Carriage Dr
- 842 Carriage Dr
- 709 Top Hill Dr
- 608 Top Hill Dr
- 717 Meadow Creek Dr
- 14237 County Road 192
- 14195 County Road 192
- 14245 County Road 192
- 1107 Larkspur Ln
- 709 W Rieck Rd
- 5401 Hollytree Dr
- 5401 Hollytree Dr Unit 1002
- 11948 Gillian Ct
- 4926 Forestwood Blvd
- 4926 4926 Forestwood Blvd
- 5002 Forestwood Blvd
- 5002 5002 Forestwood
- 4922 Forestwood Blvd
- 5006 5006 Forestwood Blvd
- 5006 Forestwood Blvd
- 4918 Forestwood Blvd
- 5010 5010 Forestwood Blvd
- 5010 Forestwood Blvd
- 4929 4929 Forestwood Blvd
- 4914 Forestwood Blvd
- 5001 Forestwood Blvd
- 4929 Forestwood Blvd
- 5005 5005 Forestwood
- 5005 Forestwood Blvd
- 5009 Forestwood Blvd
- 5014 Forestwood Blvd
- 4925 Forestwood Blvd
- 5014 5014 Forestwood