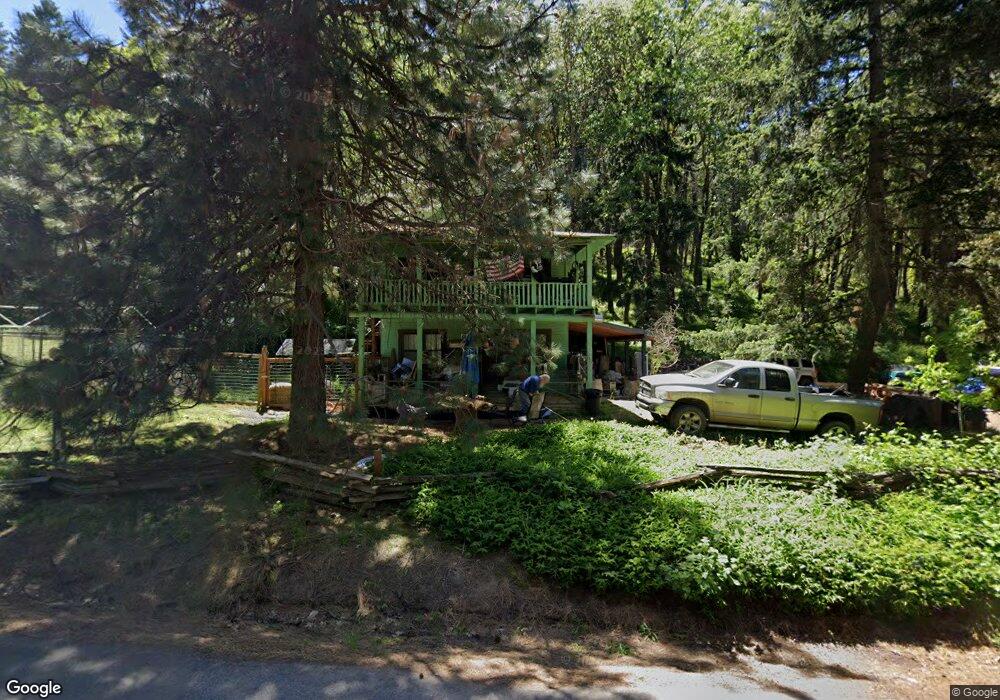
4930 Old Highway 99 S Ashland, OR 97520
Estimated Value: $346,000 - $387,758
3
Beds
1
Bath
1,728
Sq Ft
$215/Sq Ft
Est. Value
About This Home
This home is located at 4930 Old Highway 99 S, Ashland, OR 97520 and is currently estimated at $370,919, approximately $214 per square foot. 4930 Old Highway 99 S is a home located in Jackson County with nearby schools including Bellview Elementary School, Ashland Middle School, and Ashland High School.
Ownership History
Date
Name
Owned For
Owner Type
Purchase Details
Closed on
Aug 24, 2010
Sold by
Borgilt Brint and Sutton Borgilt Laureen
Bought by
Federal National Mortgage Association
Current Estimated Value
Purchase Details
Closed on
Mar 29, 2007
Sold by
Borgilt Brint and Borgilt Laureen
Bought by
Borgilt Brint and Sutton Borgilt Laureen
Home Financials for this Owner
Home Financials are based on the most recent Mortgage that was taken out on this home.
Original Mortgage
$243,750
Interest Rate
6.2%
Mortgage Type
New Conventional
Purchase Details
Closed on
Jan 14, 1998
Sold by
Lee Joanne E and Lee Johana E
Bought by
Borgilt Brint and Borgilt Laureen
Home Financials for this Owner
Home Financials are based on the most recent Mortgage that was taken out on this home.
Original Mortgage
$26,601
Interest Rate
7.14%
Mortgage Type
Seller Take Back
Purchase Details
Closed on
Aug 12, 1992
Sold by
Trulove Kele Lee Reed and Reed Erin
Bought by
Lee Joanne E
Create a Home Valuation Report for This Property
The Home Valuation Report is an in-depth analysis detailing your home's value as well as a comparison with similar homes in the area
Home Values in the Area
Average Home Value in this Area
Purchase History
| Date | Buyer | Sale Price | Title Company |
|---|---|---|---|
| Federal National Mortgage Association | $263,268 | Fa | |
| Borgilt Brint | -- | Lawyers Title Ins | |
| Borgilt Brint | $120,000 | Jackson County Title | |
| Lee Joanne E | $90,000 | Jackson County Title |
Source: Public Records
Mortgage History
| Date | Status | Borrower | Loan Amount |
|---|---|---|---|
| Previous Owner | Borgilt Brint | $243,750 | |
| Previous Owner | Borgilt Brint | $26,601 | |
| Closed | Borgilt Brint | $40,000 |
Source: Public Records
Tax History Compared to Growth
Tax History
| Year | Tax Paid | Tax Assessment Tax Assessment Total Assessment is a certain percentage of the fair market value that is determined by local assessors to be the total taxable value of land and additions on the property. | Land | Improvement |
|---|---|---|---|---|
| 2025 | $3,142 | $218,390 | $171,090 | $47,300 |
| 2024 | $3,142 | $212,030 | $146,520 | $65,510 |
| 2023 | $3,041 | $205,860 | $142,260 | $63,600 |
| 2022 | $2,944 | $205,860 | $142,260 | $63,600 |
| 2021 | $2,844 | $199,870 | $138,120 | $61,750 |
| 2020 | $2,766 | $194,050 | $134,100 | $59,950 |
| 2019 | $2,708 | $182,920 | $126,420 | $56,500 |
| 2018 | $2,561 | $177,600 | $122,750 | $54,850 |
| 2017 | $2,547 | $177,600 | $122,750 | $54,850 |
| 2016 | $2,490 | $167,410 | $115,710 | $51,700 |
| 2015 | $2,414 | $167,410 | $115,710 | $51,700 |
| 2014 | -- | $157,810 | $109,080 | $48,730 |
Source: Public Records
Map
Nearby Homes
- 0 Old Hwy 99 Unit 220199869
- 5010 Old Highway 99 S
- 4492 Old Highway 99 S
- 500 Conifer Way
- 5631 Old Highway 99 S
- 545 Conifer Way
- 3721 Old Highway 99 S
- 492 Conifer Way
- 4712 Old Highway 99 S
- 1988 Old Siskiyou Hwy
- 1694 Old Siskiyou Hwy
- 9840 Mount Ashland Ski Rd
- 2345 Old Greensprings Hwy
- 0 Highway 99 Unit 220209869
- 0 Colestin Rd Unit 104385842
- 700 Neil Creek Rd
- 500 Mt Ashland Ski Rd
- 855 Reiten Dr
- 4260 Clayton Rd
- 108 Baldy Creek Rd
- 4930 S Old 99 Hwy
- 0 Old Hwy 99 Unit 100258535
- 0 Old Hwy 99 Unit 220181317
- 0 Old Hwy 99 Unit 220157818
- 0 Old Hwy 99 Unit 102802624
- 0 Old Hwy 99 Unit 102803831
- 0 Old Hwy 99 Unit 1301 152913266
- 0 Old Hwy 99 Unit 152918434
- 0 Old Hwy 99 Unit 220149527
- 0 Old Hwy 99 Unit 103003160
- 0 Old Hwy 99 Tl 301 Blvd S Unit 102980978
- 4780 Old Highway 99 S
- 5070 Old Highway 99 S
- 5070 S Old 99 Hwy
- 0 Old Highway 99 S Unit 100253424
- 0 Old Highway 99 S Unit 100246644
- 0 Old Highway 99 S Unit 100230242
- 0 Old Highway 99 S Unit 102959216
- 0 Old Highway 99 S Unit 220101575
- 0 Old Hwy 99 Tl 300 Hwy S Unit 102980979