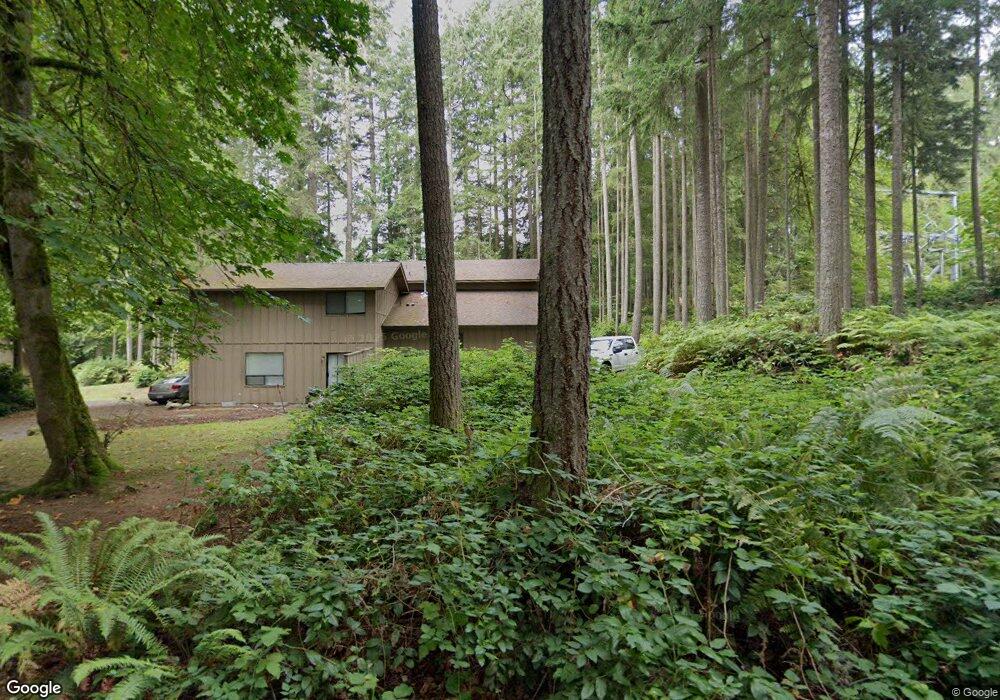
4931 Lovely Ln SE Port Orchard, WA 98367
Estimated Value: $516,000 - $679,000
4
Beds
2
Baths
2,152
Sq Ft
$271/Sq Ft
Est. Value
About This Home
This home is located at 4931 Lovely Ln SE, Port Orchard, WA 98367 and is currently estimated at $583,129, approximately $270 per square foot. 4931 Lovely Ln SE is a home with nearby schools including South Colby Elementary School, John Sedgwick Middle School, and South Kitsap High School.
Ownership History
Date
Name
Owned For
Owner Type
Purchase Details
Closed on
May 14, 2007
Sold by
Blue Heron Holdings One Llc
Bought by
Carter Karen I
Current Estimated Value
Purchase Details
Closed on
Jul 12, 2006
Sold by
Carter Karen
Bought by
Blue Heron Holdings One Llc
Purchase Details
Closed on
Mar 27, 2006
Sold by
Bk Lovely Llc
Bought by
Carter Karen I
Home Financials for this Owner
Home Financials are based on the most recent Mortgage that was taken out on this home.
Original Mortgage
$214,200
Interest Rate
3%
Mortgage Type
Fannie Mae Freddie Mac
Purchase Details
Closed on
Mar 22, 2006
Sold by
Maxwell Richard A and Maxwell Kellie B
Bought by
Bk Lovely Llc
Home Financials for this Owner
Home Financials are based on the most recent Mortgage that was taken out on this home.
Original Mortgage
$214,200
Interest Rate
3%
Mortgage Type
Fannie Mae Freddie Mac
Purchase Details
Closed on
May 26, 1999
Sold by
Lovely Steven C and Lovely Susan M
Bought by
Bk Lovely Llc
Create a Home Valuation Report for This Property
The Home Valuation Report is an in-depth analysis detailing your home's value as well as a comparison with similar homes in the area
Home Values in the Area
Average Home Value in this Area
Purchase History
| Date | Buyer | Sale Price | Title Company |
|---|---|---|---|
| Carter Karen I | -- | None Available | |
| Blue Heron Holdings One Llc | -- | None Available | |
| Carter Karen I | $268,031 | Land Title Company | |
| Bk Lovely Llc | -- | Land Title Company | |
| Bk Lovely Llc | -- | -- |
Source: Public Records
Mortgage History
| Date | Status | Borrower | Loan Amount |
|---|---|---|---|
| Previous Owner | Carter Karen I | $214,200 |
Source: Public Records
Tax History Compared to Growth
Tax History
| Year | Tax Paid | Tax Assessment Tax Assessment Total Assessment is a certain percentage of the fair market value that is determined by local assessors to be the total taxable value of land and additions on the property. | Land | Improvement |
|---|---|---|---|---|
| 2026 | $4,448 | $503,440 | $93,100 | $410,340 |
| 2025 | $4,448 | $503,440 | $93,100 | $410,340 |
| 2024 | $4,313 | $503,440 | $93,100 | $410,340 |
| 2023 | $4,280 | $503,440 | $93,100 | $410,340 |
| 2022 | $4,092 | $402,760 | $74,480 | $328,280 |
| 2021 | $4,108 | $384,520 | $66,500 | $318,020 |
| 2020 | $3,265 | $293,390 | $61,250 | $232,140 |
| 2019 | $2,877 | $272,290 | $56,840 | $215,450 |
| 2018 | $2,917 | $242,620 | $51,450 | $191,170 |
| 2017 | $2,690 | $242,620 | $51,450 | $191,170 |
| 2016 | $2,615 | $215,900 | $49,000 | $166,900 |
| 2015 | $2,523 | $211,350 | $49,000 | $162,350 |
| 2014 | $2,449 | $199,250 | $53,710 | $145,540 |
| 2013 | $2,336 | $199,250 | $53,710 | $145,540 |
Source: Public Records
Map
Nearby Homes
- 5159 Country Club Way SE
- 4826 SE Sleepy Hollow Ct
- 4798 SE Sleepy Hollow Ct
- 4808 SE Sleepy Hollow Ct
- 5544 Clover Valley Rd SE
- 5310 SE Sedgwick Rd
- 4646 SE Green Shores Dr
- 4213 SE Salmonberry Rd
- 3707 SE Chesterton Dr
- 3365 SE Carmae Dr
- 3628 Creek View Ct SE
- 6223 Ebbert Dr SE
- 3341 SE Property Ct
- 4060 SE Saxon Ct
- 3235 Westminster Dr SE
- 6724 SE Sedgwick Rd
- 3463 Balsam Blvd SE
- 4590 Laguna Ln SE
- 2863 Rocky Creek Ln SE
- 2948 SE Alson Ct
- 4939 Lovely Ln SE
- 4921 Lovely Ln SE
- 4797 SE Constitution Ct
- 4879 Lovely Ln SE
- 4911 Lovely Ln SE
- 4988 Lovely Ln SE
- 4878 Lovely Ln SE
- 4798 SE Constitution Ct
- 4980 Lovely Ln SE
- 4901 Lovely Ln SE
- 4781 SE Constitution Ct
- 4881 Lovely Ln SE
- 4891 Lovely Ln SE
- 4782 SE Constitution Ct
- 4990 A/B Lovely Ln SE
- 4990 Lovely Ln SE
- 4911 SE Sedgwick Rd
- 4765 SE Constitution Ct
- 4871 Lovely Ln SE
- 4766 SE Constitution Ct