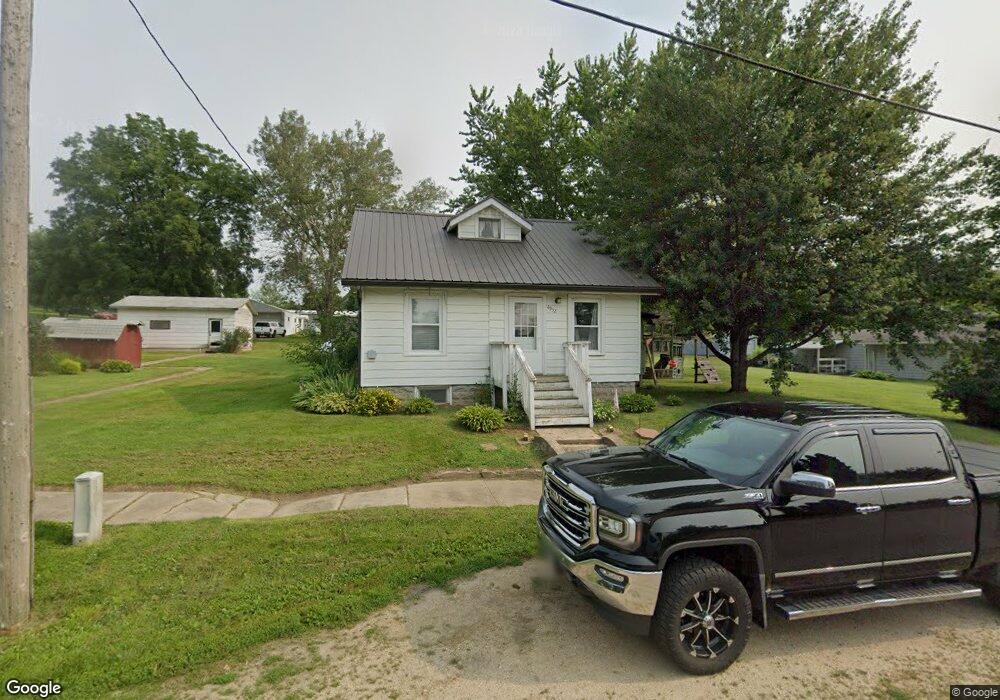
4932 47th St Baldwin, IA 52207
Estimated Value: $61,000 - $133,000
2
Beds
2
Baths
1,056
Sq Ft
$98/Sq Ft
Est. Value
About This Home
This home is located at 4932 47th St, Baldwin, IA 52207 and is currently estimated at $103,196, approximately $97 per square foot. 4932 47th St is a home with nearby schools including Cardinal Elementary School, Briggs Elementary School, and Maquoketa Middle School.
Ownership History
Date
Name
Owned For
Owner Type
Purchase Details
Closed on
Aug 31, 2021
Sold by
Bock Anthony C
Bought by
Bock Allison M
Current Estimated Value
Purchase Details
Closed on
Aug 15, 2006
Sold by
Agnitsch Steven L and Agnitsch Stacy A
Bought by
Bock Anthony C and Bock Allison M
Home Financials for this Owner
Home Financials are based on the most recent Mortgage that was taken out on this home.
Original Mortgage
$61,000
Outstanding Balance
$36,037
Interest Rate
6.85%
Mortgage Type
New Conventional
Estimated Equity
$67,159
Create a Home Valuation Report for This Property
The Home Valuation Report is an in-depth analysis detailing your home's value as well as a comparison with similar homes in the area
Purchase History
We collect this data history from publicly available records. To have your information removed, we recommend requesting removal directly through your county’s website.
| Date | Buyer | Sale Price | Title Company |
|---|---|---|---|
| Bock Allison M | -- | None Available | |
| Bock Anthony C | $61,000 | None Available |
Source: Public Records
Mortgage History
We collect this data history from publicly available records. To have your information removed, we recommend requesting removal directly through your county’s website.
| Date | Status | Borrower | Loan Amount |
|---|---|---|---|
| Open | Bock Anthony C | $61,000 |
Source: Public Records
Tax History
| Year | Tax Paid | Tax Assessment Tax Assessment Total Assessment is a certain percentage of the fair market value that is determined by local assessors to be the total taxable value of land and additions on the property. | Land | Improvement |
|---|---|---|---|---|
| 2025 | $1,180 | $84,400 | $3,000 | $81,400 |
| 2024 | $1,180 | $75,700 | $3,000 | $72,700 |
| 2023 | $948 | $75,700 | $3,000 | $72,700 |
| 2022 | $716 | $52,100 | $3,000 | $49,100 |
| 2021 | $740 | $52,100 | $3,000 | $49,100 |
| 2020 | $740 | $51,800 | $3,000 | $48,800 |
| 2019 | $736 | $51,400 | $0 | $0 |
| 2018 | $700 | $51,400 | $0 | $0 |
| 2017 | $700 | $59,400 | $0 | $0 |
| 2016 | $838 | $59,400 | $0 | $0 |
| 2015 | $838 | $59,400 | $0 | $0 |
| 2014 | $874 | $59,400 | $0 | $0 |
Source: Public Records
Map
Nearby Homes
- 10383 1st Ave
- 8897 20th Ave
- 1030 105th St
- 302 Long Ave
- 728 Country Club Dr
- 307 Ehlers Ln
- 503 & 507 Rosemere Ln
- 1005 W Summit St
- 1009 German St
- 401-435 Forest Dr
- 401-435 Forest Dr Unit Meadow Park Subdivis
- 105 E Main St
- 311 Western Ave
- 406 Broadway St
- 309 Main St
- 802 Grant Ct
- 220 N Arcade St
- 707 W Platt St
- 305 W Main St
- 313 S 4th St
Your Personal Tour Guide
Ask me questions while you tour the home.