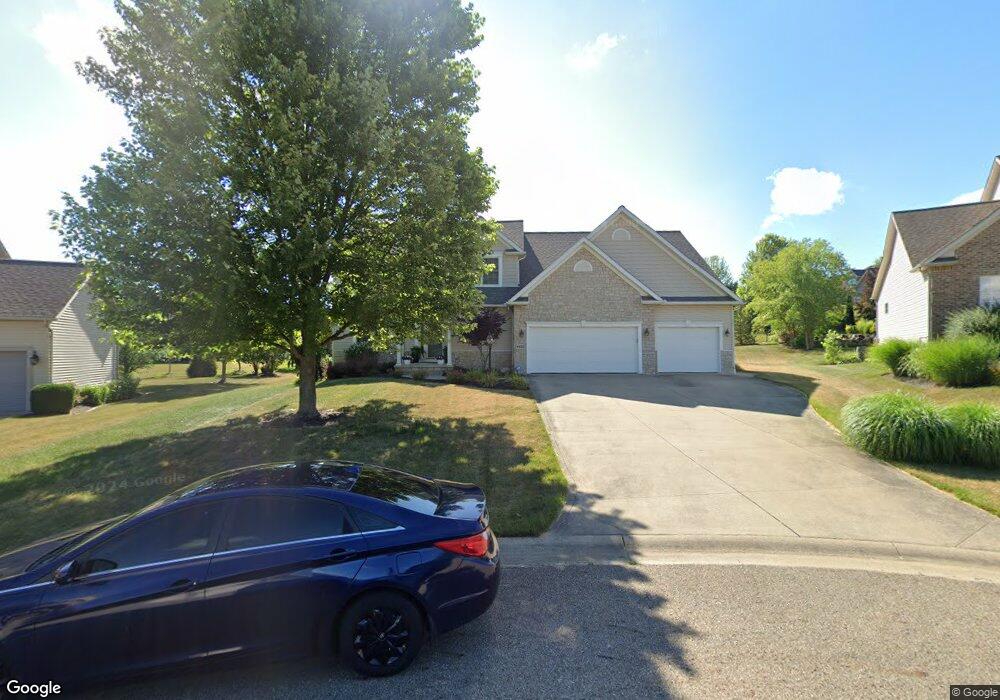
4932 Stanbury Cir NW Massillon, OH 44646
Amherst Heights-Clearview NeighborhoodEstimated Value: $486,243 - $617,000
4
Beds
3
Baths
2,967
Sq Ft
$186/Sq Ft
Est. Value
About This Home
This home is located at 4932 Stanbury Cir NW, Massillon, OH 44646 and is currently estimated at $552,561, approximately $186 per square foot. 4932 Stanbury Cir NW is a home located in Stark County with nearby schools including Sauder Elementary School, Jackson Memorial Middle School, and Jackson High School.
Ownership History
Date
Name
Owned For
Owner Type
Purchase Details
Closed on
Mar 29, 2018
Sold by
Bcs Capital Partners 2
Bought by
Nemet Bryan and Nemet Jennifer
Current Estimated Value
Home Financials for this Owner
Home Financials are based on the most recent Mortgage that was taken out on this home.
Original Mortgage
$297,000
Outstanding Balance
$255,058
Interest Rate
4.38%
Mortgage Type
New Conventional
Estimated Equity
$297,503
Purchase Details
Closed on
May 25, 2017
Sold by
Moore Todd L
Bought by
Bcs Capital Partners 2
Purchase Details
Closed on
Apr 24, 2017
Sold by
Moore Todd L
Bought by
Bcs Capital Partners
Purchase Details
Closed on
Nov 16, 2006
Sold by
Rea Building Corp
Bought by
Moore Todd L and Mccoy Moore Ronna M
Home Financials for this Owner
Home Financials are based on the most recent Mortgage that was taken out on this home.
Original Mortgage
$248,000
Interest Rate
6.36%
Mortgage Type
Purchase Money Mortgage
Purchase Details
Closed on
Apr 13, 2006
Sold by
Amherst Group Llc
Bought by
Rea Building Corp
Home Financials for this Owner
Home Financials are based on the most recent Mortgage that was taken out on this home.
Original Mortgage
$275,000
Interest Rate
6.34%
Mortgage Type
Construction
Create a Home Valuation Report for This Property
The Home Valuation Report is an in-depth analysis detailing your home's value as well as a comparison with similar homes in the area
Home Values in the Area
Average Home Value in this Area
Purchase History
| Date | Buyer | Sale Price | Title Company |
|---|---|---|---|
| Nemet Bryan | $370,000 | None Available | |
| Bcs Capital Partners 2 | $24,600 | None Available | |
| Bcs Capital Partners | $246,000 | None Available | |
| Moore Todd L | $310,000 | Attorney | |
| Rea Building Corp | $48,500 | None Available |
Source: Public Records
Mortgage History
| Date | Status | Borrower | Loan Amount |
|---|---|---|---|
| Open | Nemet Bryan | $297,000 | |
| Previous Owner | Moore Todd L | $248,000 | |
| Previous Owner | Rea Building Corp | $275,000 |
Source: Public Records
Tax History Compared to Growth
Tax History
| Year | Tax Paid | Tax Assessment Tax Assessment Total Assessment is a certain percentage of the fair market value that is determined by local assessors to be the total taxable value of land and additions on the property. | Land | Improvement |
|---|---|---|---|---|
| 2025 | -- | $150,720 | $31,400 | $119,320 |
| 2024 | -- | $150,720 | $31,400 | $119,320 |
| 2023 | $5,778 | $115,790 | $29,020 | $86,770 |
| 2022 | $2,874 | $115,790 | $29,020 | $86,770 |
| 2021 | $5,771 | $115,790 | $29,020 | $86,770 |
| 2020 | $5,426 | $100,040 | $25,030 | $75,010 |
| 2019 | $5,226 | $100,040 | $25,030 | $75,010 |
| 2018 | $5,253 | $100,040 | $25,030 | $75,010 |
| 2017 | $5,124 | $92,860 | $23,140 | $69,720 |
| 2016 | $5,229 | $94,120 | $23,140 | $70,980 |
| 2015 | $5,292 | $94,120 | $23,140 | $70,980 |
| 2014 | $1,055 | $85,960 | $21,140 | $64,820 |
| 2013 | $2,486 | $85,960 | $21,140 | $64,820 |
Source: Public Records
Map
Nearby Homes
- 8798 Stoneshire St NW
- 8555 Esquire St NW
- 5271 Lake Vista Cir NW
- 8325 Condor Cir NW
- 8309 Gentry St NW
- 4792 Revere Ave NW
- 5221 Revere Ave NW
- 4456 Red Panda Cir NW
- 8459 Audubon St NW
- 4450 Trail Head Cir NW
- 5265 Pin Oak Ave NW
- 4428 Trail Head Cir NW
- 8259 Buckingham Cir NW
- 5484 High Mill Ave NW
- 8251 Audubon St NW
- 4374 Forest Glen Ave NW Unit 8
- 4338 Greenway Trail St NW Unit 36
- 5679 Carters Grove Cir NW
- 8079 Windward Trace Cir NW
- 4195 Columbia Ave NW
- 4924 Stanbury Cir NW
- 4948 Stanbury Cir NW
- 4931 Simsbury Cir NW
- 4947 Simsbury Cir NW
- 4923 Simsbury Cir NW
- 4964 Stanbury Cir NW
- 4925 Stanbury Cir NW
- 8697 Dublin Ridge Cir NW Unit 8B
- 4963 Simsbury Cir NW
- 8695 Dublin Ridge Cir NW Unit 8C
- 4933 Stanbury Cir NW
- 8691 Dublin Ridge Cir NW Unit 8A
- 4949 Stanbury Cir NW
- 8693 Dublin Ridge Cir NW Unit 8D
- 4982 Stanbury Cir NW
- 4965 Stanbury Cir NW
- 4981 Simsbury Cir NW
- 8687 Dublin Ridge Cir NW Unit B7
- 4922 Simsbury Cir NW
- 8681 Dublin Ridge Cir NW Unit 7A