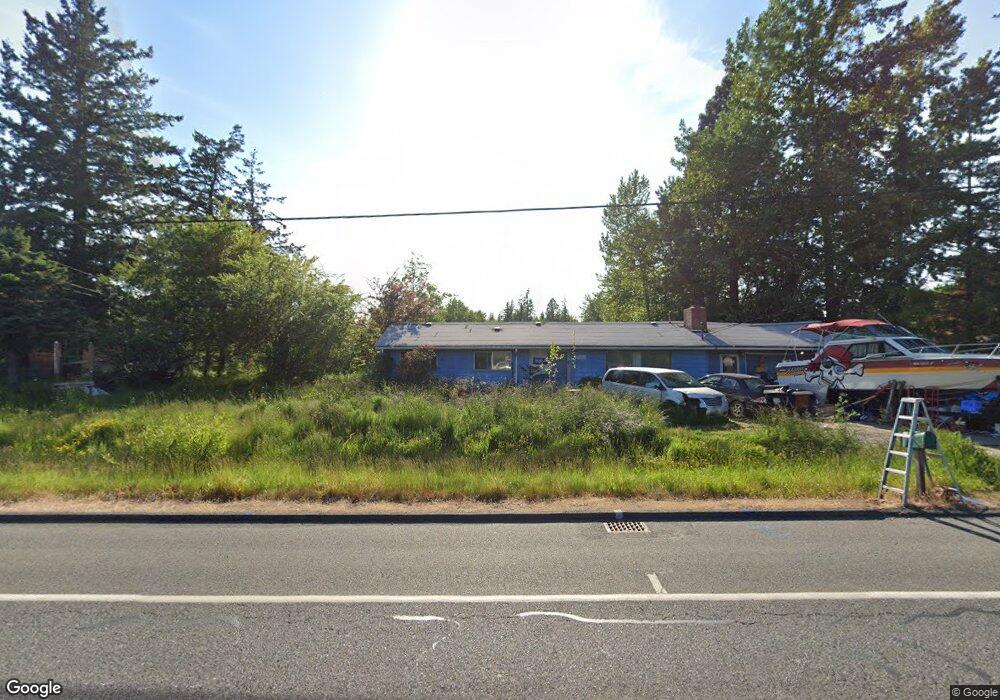
4933 Guide Meridian Bellingham, WA 98226
Estimated Value: $692,000 - $737,345
4
Beds
3
Baths
2,164
Sq Ft
$332/Sq Ft
Est. Value
About This Home
This home is located at 4933 Guide Meridian, Bellingham, WA 98226 and is currently estimated at $717,836, approximately $331 per square foot. 4933 Guide Meridian is a home located in Whatcom County with nearby schools including Irene Reither Elementary School, Meridian Middle School, and Meridian High School.
Create a Home Valuation Report for This Property
The Home Valuation Report is an in-depth analysis detailing your home's value as well as a comparison with similar homes in the area
Home Values in the Area
Average Home Value in this Area
Tax History Compared to Growth
Tax History
| Year | Tax Paid | Tax Assessment Tax Assessment Total Assessment is a certain percentage of the fair market value that is determined by local assessors to be the total taxable value of land and additions on the property. | Land | Improvement |
|---|---|---|---|---|
| 2024 | $767 | $721,191 | $331,934 | $389,257 |
| 2023 | $767 | $716,486 | $342,200 | $374,286 |
| 2022 | $1,036 | $716,169 | $299,037 | $258,123 |
| 2021 | $2,339 | $568,388 | $237,331 | $258,123 |
| 2020 | $2,432 | $502,993 | $210,025 | $292,968 |
| 2019 | $3,999 | $443,168 | $185,045 | $258,123 |
| 2018 | $4,651 | $398,361 | $166,336 | $232,025 |
| 2017 | $3,985 | $352,532 | $147,200 | $205,332 |
| 2016 | $3,881 | $319,493 | $144,749 | $174,744 |
| 2015 | $3,653 | $309,704 | $140,314 | $169,390 |
| 2014 | -- | $282,679 | $128,070 | $154,609 |
| 2013 | -- | $275,885 | $124,992 | $150,893 |
Source: Public Records
Map
Nearby Homes
- 4866 Guide Meridian
- 4777 Guide Meridian Rd
- 546 (Lot 7) Northview St
- 552 (Lot 5) Northview St
- 553 (Lot 19) Northview St
- 555 (Lot 18) Northview St
- 353 Holland Ave
- 652 (Lot 30) W Kline Rd
- 662 (Lot 26) W Kline Rd
- 5140 Guide Meridian
- 409 Holland Ave
- 654 (Lot 29) W Kline Rd
- 304 Tremont Ave
- 440 Tremont Ave
- 115 155 Tremont Ave
- 700 Northview St
- 343 Tremont Ave Unit 102
- 703 Northview St
- 704 Springside Ln
- 4682 Guide Meridian
- 0 12xx Kelly Rd
- 4921 Guide Meridian
- 4905 Guide Meridian
- 4905 Guide Meridian
- 4889 Guide Meridian
- 4979 Guide Meridian
- 4923 Guide Meridian
- 4923 4921 Guide Meridian
- 4945 Guide Meridian
- 4935 Guide Meridian
- 4961 Guide Meridian
- 4961 Guide Meridian
- 4800 Guide Meridian
- 4971 Guide Meridian
- 4937 Guide Meridian
- 4900 Guide Meridian
- 14 E Kelly Rd
- 31 E Kelly Rd
- 4999 Guide Meridian
- 4916 Guide Meridian