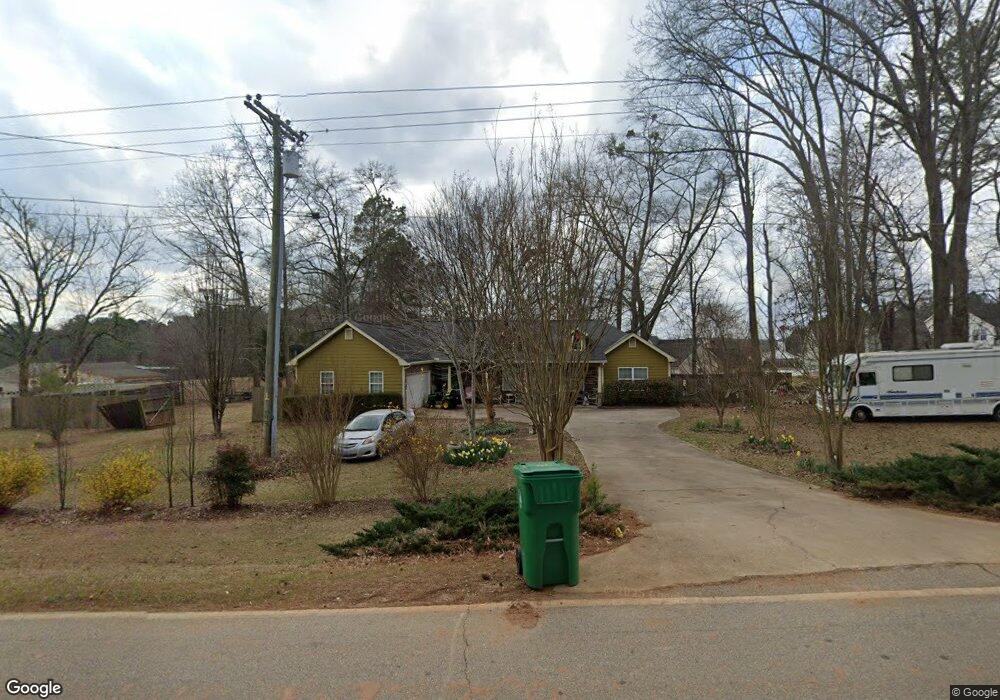
4933 Klondike Rd Lithonia, GA 30038
Estimated Value: $215,000 - $259,000
4
Beds
2
Baths
2,079
Sq Ft
$114/Sq Ft
Est. Value
About This Home
This home is located at 4933 Klondike Rd, Lithonia, GA 30038 and is currently estimated at $236,191, approximately $113 per square foot. 4933 Klondike Rd is a home located in DeKalb County with nearby schools including Murphy Candler Elementary School, Salem Middle School, and Martin Luther King- Jr. High School.
Ownership History
Date
Name
Owned For
Owner Type
Purchase Details
Closed on
Jun 17, 2011
Sold by
Henry Seth L
Bought by
Henry Sharon L
Current Estimated Value
Purchase Details
Closed on
Jun 19, 2008
Sold by
Novastar Mtg Inc
Bought by
Henry Seth L
Purchase Details
Closed on
Oct 3, 2007
Sold by
Novastar Mtg Inc
Bought by
Hubbard April
Purchase Details
Closed on
Aug 22, 2006
Sold by
Jones Raphael
Bought by
Hubbard April
Home Financials for this Owner
Home Financials are based on the most recent Mortgage that was taken out on this home.
Original Mortgage
$83,700
Interest Rate
11.2%
Mortgage Type
New Conventional
Purchase Details
Closed on
Nov 5, 2002
Sold by
Minor Thomas E
Bought by
Jones Raphael
Home Financials for this Owner
Home Financials are based on the most recent Mortgage that was taken out on this home.
Original Mortgage
$69,300
Interest Rate
9.5%
Mortgage Type
New Conventional
Create a Home Valuation Report for This Property
The Home Valuation Report is an in-depth analysis detailing your home's value as well as a comparison with similar homes in the area
Home Values in the Area
Average Home Value in this Area
Purchase History
| Date | Buyer | Sale Price | Title Company |
|---|---|---|---|
| Henry Sharon L | $120,000 | -- | |
| Henry Seth L | $22,900 | -- | |
| Hubbard April | $89,508 | -- | |
| Hubbard April | $93,000 | -- | |
| Jones Raphael | $77,000 | -- |
Source: Public Records
Mortgage History
| Date | Status | Borrower | Loan Amount |
|---|---|---|---|
| Previous Owner | Hubbard April | $83,700 | |
| Previous Owner | Jones Raphael | $69,300 |
Source: Public Records
Tax History Compared to Growth
Tax History
| Year | Tax Paid | Tax Assessment Tax Assessment Total Assessment is a certain percentage of the fair market value that is determined by local assessors to be the total taxable value of land and additions on the property. | Land | Improvement |
|---|---|---|---|---|
| 2025 | $2,515 | $99,160 | $16,000 | $83,160 |
| 2024 | $2,581 | $101,480 | $16,000 | $85,480 |
| 2023 | $2,581 | $101,840 | $16,000 | $85,840 |
| 2022 | $2,129 | $86,120 | $8,000 | $78,120 |
| 2021 | $1,672 | $66,080 | $8,000 | $58,080 |
| 2020 | $1,440 | $56,000 | $8,000 | $48,000 |
| 2019 | $1,239 | $47,440 | $8,000 | $39,440 |
| 2018 | $1,163 | $48,080 | $8,000 | $40,080 |
| 2017 | $1,223 | $44,720 | $3,640 | $41,080 |
| 2016 | $1,208 | $45,760 | $3,640 | $42,120 |
| 2014 | $890 | $31,560 | $3,640 | $27,920 |
Source: Public Records
Map
Nearby Homes
- 4934 Serena Ct
- 4842 Buchli Ln Unit 2
- 5009 Lynnonhall Ct
- 6303 Klondike River Rd
- 6226 Leverett Dr
- 5100 River Overlook Way
- 4889 Ozment Ridge Ct
- 4767 Golod Way Unit 2
- 6114 Leverett Dr
- 6386 Forester Way
- 4273 Chestnut Lake Ave
- 4708 Golod Way Unit 2
- 6874 Mahonia Place
- 4632 Garden City Dr
- 6572 Chestnut Oaks Ridge
- 6837 Mahonia Place
- 7074 Ravenwood Ln
- 7078 Ravenwood Ln
- 6279 Varnay Path Unit 1
- 6282 Varnay Path
- 4940 Klondike Rd
- 4939 Klondike Rd
- 4907 Klondike Rd
- 4948 Klondike Rd
- 6286 Varnay Path
- 6283 Varnay Path
- 6292 Varnay Path
- 6315 Ariaal Dr
- 4947 Klondike Rd
- 6321 Ariaal Dr Unit 200
- 6321 Ariaal Dr
- 6287 Varnay Path
- 6293 Varnay Path
- 4950 Klondike Rd
- 6307 Ariaal Dr
- 4944 Lynnonhall Ct
- 4944 Lynnonhall Ct Unit 33
- 4930 Lynnonhall Ct