4933 Vireo Dr Unit 98 Flowery Branch, GA 30542
Estimated Value: $285,000 - $301,000
3
Beds
3
Baths
1,674
Sq Ft
$175/Sq Ft
Est. Value
About This Home
This home is located at 4933 Vireo Dr Unit 98, Flowery Branch, GA 30542 and is currently estimated at $292,225, approximately $174 per square foot. 4933 Vireo Dr Unit 98 is a home located in Hall County with nearby schools including Flowery Branch Elementary School, West Hall Middle School, and West Hall High School.
Ownership History
Date
Name
Owned For
Owner Type
Purchase Details
Closed on
Dec 22, 2023
Sold by
Montoya Edwin
Bought by
Laub Monica
Current Estimated Value
Home Financials for this Owner
Home Financials are based on the most recent Mortgage that was taken out on this home.
Original Mortgage
$206,250
Outstanding Balance
$202,323
Interest Rate
7.29%
Mortgage Type
New Conventional
Estimated Equity
$89,902
Purchase Details
Closed on
Aug 20, 2020
Sold by
Davis Marilyn L
Bought by
Montoya Edwin
Home Financials for this Owner
Home Financials are based on the most recent Mortgage that was taken out on this home.
Original Mortgage
$180,667
Interest Rate
3%
Mortgage Type
FHA
Purchase Details
Closed on
Mar 30, 2005
Sold by
Garen Homes Inc
Bought by
Davis Marilyn L
Home Financials for this Owner
Home Financials are based on the most recent Mortgage that was taken out on this home.
Original Mortgage
$131,224
Interest Rate
5.62%
Mortgage Type
New Conventional
Purchase Details
Closed on
Jul 23, 2002
Sold by
Landstar Corp
Bought by
Garen Homes Inc
Create a Home Valuation Report for This Property
The Home Valuation Report is an in-depth analysis detailing your home's value as well as a comparison with similar homes in the area
Home Values in the Area
Average Home Value in this Area
Purchase History
| Date | Buyer | Sale Price | Title Company |
|---|---|---|---|
| Laub Monica | $275,000 | -- | |
| Montoya Edwin | $184,000 | -- | |
| Davis Marilyn L | $133,300 | -- | |
| Garen Homes Inc | $426,000 | -- |
Source: Public Records
Mortgage History
| Date | Status | Borrower | Loan Amount |
|---|---|---|---|
| Open | Laub Monica | $206,250 | |
| Previous Owner | Montoya Edwin | $180,667 | |
| Previous Owner | Davis Marilyn L | $131,224 |
Source: Public Records
Tax History Compared to Growth
Tax History
| Year | Tax Paid | Tax Assessment Tax Assessment Total Assessment is a certain percentage of the fair market value that is determined by local assessors to be the total taxable value of land and additions on the property. | Land | Improvement |
|---|---|---|---|---|
| 2025 | $3,312 | $121,000 | $20,560 | $100,440 |
| 2024 | $3,119 | $116,120 | $21,000 | $95,120 |
| 2023 | $2,732 | $108,880 | $20,000 | $88,880 |
| 2022 | $2,272 | $86,880 | $13,320 | $73,560 |
| 2021 | $1,861 | $69,880 | $7,000 | $62,880 |
| 2020 | $1,770 | $64,560 | $4,800 | $59,760 |
| 2019 | $1,763 | $63,720 | $4,800 | $58,920 |
| 2018 | $1,647 | $57,640 | $4,800 | $52,840 |
| 2017 | $1,564 | $53,400 | $4,000 | $49,400 |
| 2016 | $1,414 | $49,440 | $2,000 | $47,440 |
| 2015 | $842 | $45,520 | $6,000 | $39,520 |
| 2014 | $842 | $29,230 | $3,000 | $26,230 |
Source: Public Records
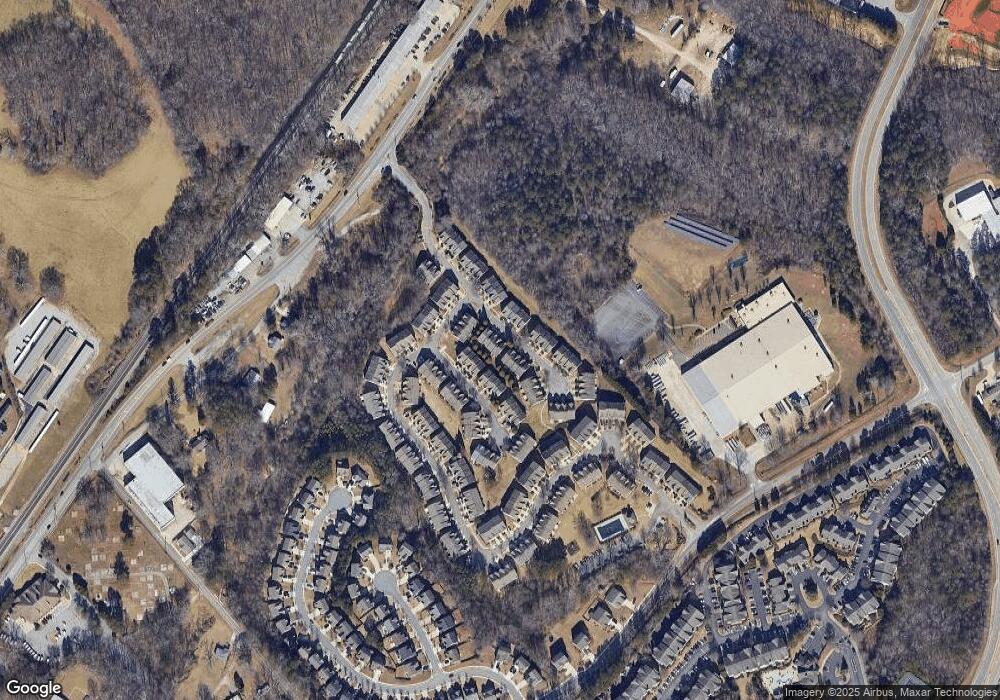
Map
Nearby Homes
- 4905 Vireo Dr
- 4836 Clarkstone Cir
- 5465 Hargrove Way
- 5357 Frontier Ct
- 5556 Coalie Trace
- 5529 Coalie Trace
- 4611 Thurmon Tanner Pkwy
- 5525 Coalie Trace
- Marigold Plan at Eastlyn Crossing - Townhomes
- Foxglove Plan at Eastlyn Crossing - Townhomes
- 5404 Falling Branch Ct
- Lancaster Plan at Eastlyn Crossing - Single Family
- Pearson Plan at Eastlyn Crossing - Single Family
- Savoy Plan at Eastlyn Crossing - Single Family
- Hampstead Plan at Eastlyn Crossing - Single Family
- Buckley Plan at Eastlyn Crossing - Single Family
- 5343 Hargrove Way
- 5333 Frontier Ct
- 5967 Screech Owl Dr
- 5325 Frontier Ct
- 4933 Vireo Dr
- 4929 Vireo Dr
- 4935 Vireo Dr
- 4927 Vireo Dr Unit 25C
- 4927 Vireo Dr
- 4937 Vireo Dr
- 4939 Vireo Dr Unit 24-D
- 4939 Vireo Dr
- 4939 Vireo Dr Unit D
- 4925 Vireo Dr
- 4925 Vireo Dr Unit B
- 4923 Vireo Dr
- 4811 Zephyr Cove Place Unit 4811
- 4811 Zephyr Cove Place
- 4815 Zephyr Cove Place Unit 4818
- 4815 Zephyr Cove Place Unit .
- 4815 Zephyr Cove Place
- 4815 Zephyr Cove Place
- 4809 Zephyr Cove Place
- 4817 Zephyr Cove Place Unit 4817