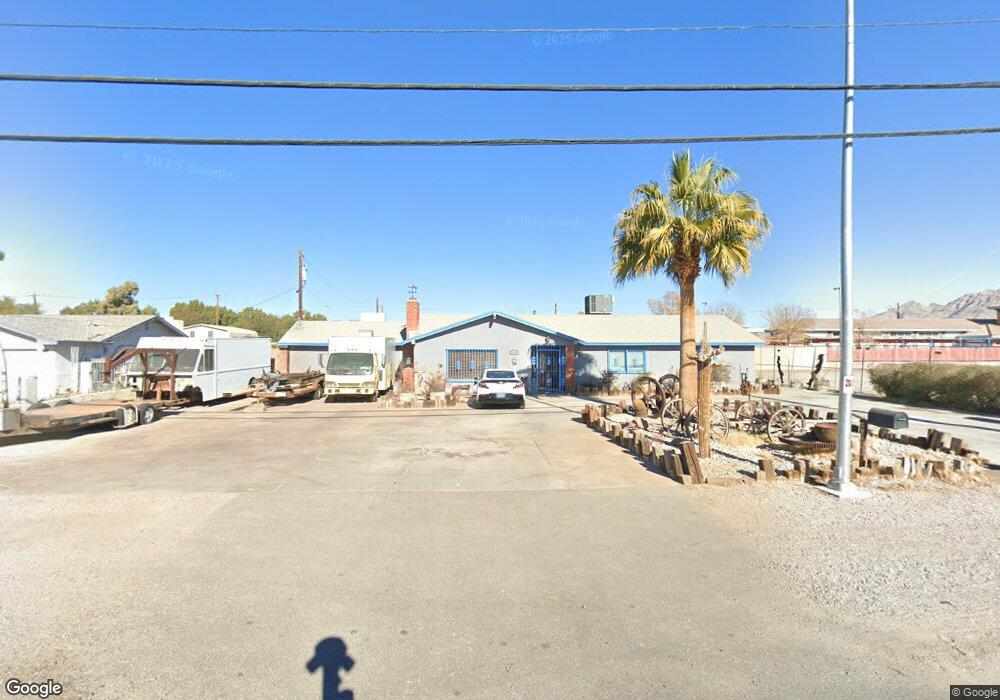
4934 E Desert Inn Rd Las Vegas, NV 89121
Estimated Value: $411,000 - $724,000
4
Beds
2
Baths
3,025
Sq Ft
$187/Sq Ft
Est. Value
About This Home
This home is located at 4934 E Desert Inn Rd, Las Vegas, NV 89121 and is currently estimated at $565,577, approximately $186 per square foot. 4934 E Desert Inn Rd is a home located in Clark County with nearby schools including Laura Dearing Elementary School, Jerome Mack Middle School, and Chaparral High School.
Ownership History
Date
Name
Owned For
Owner Type
Purchase Details
Closed on
Feb 25, 2014
Sold by
Fisher Barbara Jeanne and Stevens Barbara J
Bought by
Stevens Barbara J and Stevens Scott C
Current Estimated Value
Purchase Details
Closed on
Feb 11, 1997
Sold by
Randono Barbara Jeanne
Bought by
Fisher Barbara J
Home Financials for this Owner
Home Financials are based on the most recent Mortgage that was taken out on this home.
Original Mortgage
$98,800
Outstanding Balance
$11,463
Interest Rate
7.85%
Estimated Equity
$554,114
Purchase Details
Closed on
Apr 20, 1995
Sold by
Bowman Loretta
Bought by
Randono Barbara Jeanne
Home Financials for this Owner
Home Financials are based on the most recent Mortgage that was taken out on this home.
Original Mortgage
$87,750
Interest Rate
10.25%
Purchase Details
Closed on
Dec 31, 1992
Sold by
Randono Carroll T
Bought by
Randono James Paul and Randono Barbara Jeanne
Create a Home Valuation Report for This Property
The Home Valuation Report is an in-depth analysis detailing your home's value as well as a comparison with similar homes in the area
Home Values in the Area
Average Home Value in this Area
Purchase History
| Date | Buyer | Sale Price | Title Company |
|---|---|---|---|
| Stevens Barbara J | -- | None Available | |
| Fisher Barbara J | -- | Old Republic Title Company | |
| Randono Barbara Jeanne | -- | Old Republic Title Company | |
| Randono James Paul | $44,000 | -- |
Source: Public Records
Mortgage History
| Date | Status | Borrower | Loan Amount |
|---|---|---|---|
| Open | Fisher Barbara J | $98,800 | |
| Previous Owner | Randono Barbara Jeanne | $87,750 |
Source: Public Records
Tax History Compared to Growth
Tax History
| Year | Tax Paid | Tax Assessment Tax Assessment Total Assessment is a certain percentage of the fair market value that is determined by local assessors to be the total taxable value of land and additions on the property. | Land | Improvement |
|---|---|---|---|---|
| 2025 | $2,192 | $123,778 | $52,500 | $71,278 |
| 2024 | $2,129 | $123,778 | $52,500 | $71,278 |
| 2023 | $2,129 | $119,275 | $50,400 | $68,875 |
| 2022 | $2,067 | $105,585 | $42,000 | $63,585 |
| 2021 | $2,007 | $94,612 | $33,600 | $61,012 |
| 2020 | $1,945 | $89,086 | $28,000 | $61,086 |
| 2019 | $1,889 | $91,551 | $30,800 | $60,751 |
| 2018 | $1,834 | $83,297 | $24,500 | $58,797 |
| 2017 | $2,376 | $81,023 | $21,000 | $60,023 |
| 2016 | $1,737 | $71,775 | $16,800 | $54,975 |
| 2015 | $1,552 | $68,469 | $16,800 | $51,669 |
| 2014 | $1,507 | $49,833 | $17,500 | $32,333 |
Source: Public Records
Map
Nearby Homes
- 4938 Vista Flora Way
- 3415 Encina Dr
- 3462 Huerta Dr
- 3127 Aloha Ave
- 3394 Allegheny Dr
- 4731 Fuentes Way
- 3341 Death Valley Dr
- 4954 Mar Vista Way
- 3441 Cape Cod Dr
- 4794 Saguaro Way
- 3351 Fort Smith Dr
- 3470 Cape Cod Dr
- 3603 Huerta Dr
- Summit Plan at Sunterra
- Spring Plan at Sunterra
- Willow Plan at Sunterra
- 3345 Gulf Shores Dr
- 3361 Gulf Shores Dr
- 3033 Dagny St
- 3033 Dagny St Unit lot 20
- 4924 E Desert Inn Rd
- 4906 E Desert Inn Rd
- 4906 Fuentes Cir
- 4898 Fuentes Cir
- 4874 E Desert Inn Rd
- 4925 Linda Ave
- 4915 Linda Ave
- 4905 Fuentes Cir
- 4890 Fuentes Cir
- 4860 E Desert Inn Rd
- 4956 Hildago Way
- 4879 Linda Ave
- 4964 Hildago Way
- 4882 Fuentes Cir
- 4916 Hildago Way
- 4972 Hildago Way
- 4908 Hildago Way
- 4889 Fuentes Cir
- 4874 Fuentes Cir
- 4924 Linda Ave