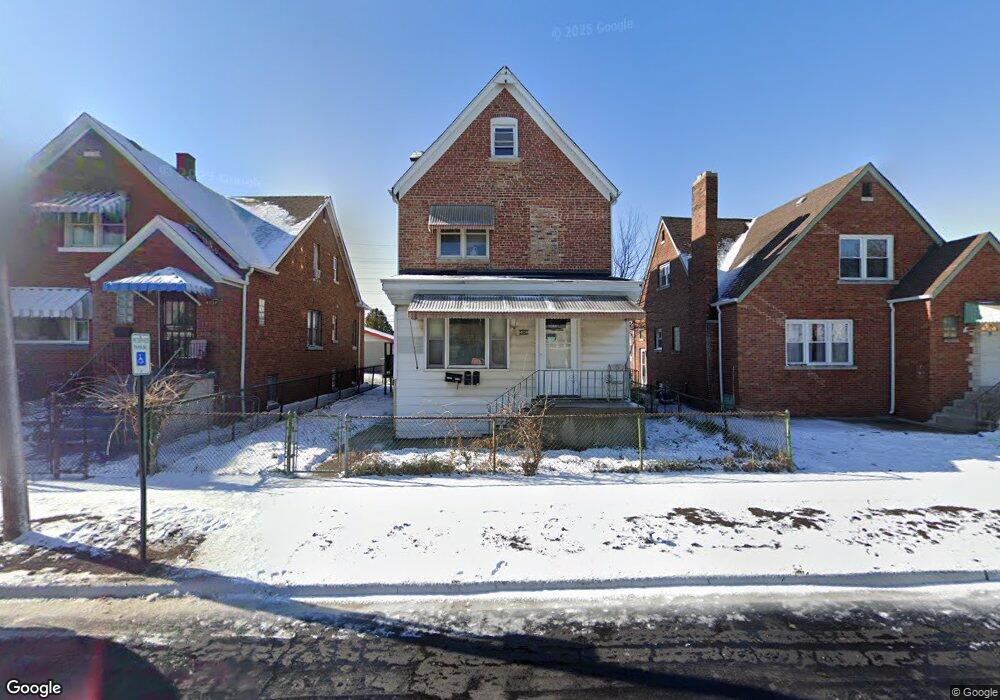
4934 Walsh Ave East Chicago, IN 46312
Southside NeighborhoodEstimated Value: $178,000 - $193,000
4
Beds
3
Baths
2,020
Sq Ft
$91/Sq Ft
Est. Value
About This Home
This home is located at 4934 Walsh Ave, East Chicago, IN 46312 and is currently estimated at $184,667, approximately $91 per square foot. 4934 Walsh Ave is a home located in Lake County with nearby schools including East Chicago Central High School, St Stanislaus School, and Greater First Christian Aca.
Ownership History
Date
Name
Owned For
Owner Type
Purchase Details
Closed on
Dec 15, 2022
Sold by
Del Real Yolanda
Bought by
Alvarez Antonio X and Del Real Yolanda
Current Estimated Value
Purchase Details
Closed on
May 8, 2013
Sold by
Xavier Research Institute Limited
Bought by
Delreal Ylanda
Home Financials for this Owner
Home Financials are based on the most recent Mortgage that was taken out on this home.
Original Mortgage
$56,400
Interest Rate
3.39%
Mortgage Type
New Conventional
Purchase Details
Closed on
Oct 17, 2012
Sold by
Alvarez Antonio X
Bought by
Xavier Research Institute Ltd
Purchase Details
Closed on
Jun 5, 2011
Sold by
Alvarez Guadalupe
Bought by
Alvarez Antonio X
Purchase Details
Closed on
May 18, 2011
Sold by
Mulholland Kelly M
Bought by
Alvarez Guadalupe
Purchase Details
Closed on
May 31, 2007
Sold by
Mulholland Shirley M
Bought by
Mulholland Kelly M
Create a Home Valuation Report for This Property
The Home Valuation Report is an in-depth analysis detailing your home's value as well as a comparison with similar homes in the area
Home Values in the Area
Average Home Value in this Area
Purchase History
| Date | Buyer | Sale Price | Title Company |
|---|---|---|---|
| Alvarez Antonio X | -- | -- | |
| Delreal Ylanda | -- | Fidelity National Title Co | |
| Xavier Research Institute Ltd | -- | None Available | |
| Alvarez Antonio X | $15,500 | None Available | |
| Alvarez Antonio X | $15,500 | None Available | |
| Alvarez Guadalupe | $14,500 | None Available | |
| Mulholland Kelly M | -- | None Available |
Source: Public Records
Mortgage History
| Date | Status | Borrower | Loan Amount |
|---|---|---|---|
| Previous Owner | Delreal Ylanda | $56,400 |
Source: Public Records
Tax History Compared to Growth
Tax History
| Year | Tax Paid | Tax Assessment Tax Assessment Total Assessment is a certain percentage of the fair market value that is determined by local assessors to be the total taxable value of land and additions on the property. | Land | Improvement |
|---|---|---|---|---|
| 2024 | $4,668 | $106,600 | $15,200 | $91,400 |
| 2023 | $1,868 | $97,800 | $15,200 | $82,600 |
| 2022 | $1,868 | $93,400 | $15,700 | $77,700 |
| 2021 | $1,492 | $74,600 | $7,800 | $66,800 |
| 2020 | $1,402 | $70,100 | $7,800 | $62,300 |
| 2019 | $1,564 | $63,800 | $7,800 | $56,000 |
| 2018 | $1,591 | $61,100 | $7,800 | $53,300 |
| 2017 | $1,652 | $62,400 | $7,800 | $54,600 |
| 2016 | $1,671 | $61,100 | $7,800 | $53,300 |
| 2014 | $999 | $39,100 | $7,800 | $31,300 |
| 2013 | $1,112 | $43,600 | $7,800 | $35,800 |
Source: Public Records
Map
Nearby Homes
- 4921 Walsh Ave Unit 23
- 4856 Wegg Ave
- 5041 Walsh Ave
- 4916 Northcote Ave
- 4927-29 Chestnut Ave
- 5015 Homerlee Ave
- 4947 Northcote Ave
- 4847 Northcote Ave
- 5001 Baring Ave
- 5010 Magoun Ave
- 5018 Magoun Ave
- 4812 Linden Ave
- 4518 Geneva Glenn Ct
- 4514 Geneva Glenn Ct
- 4522 Geneva Glenn Ct
- 1206 W Chicago Ave
- 1300 W 145th St
- 617 W 151st St
- 4502-04 Magoun Ave
- 4716 Elm Ave
- 4938 Walsh Ave
- 4930 Walsh Ave
- 4928 Walsh Ave
- 4940 Walsh Ave
- 4944 Walsh Ave
- 4924 Walsh Ave
- 4935 White Oak Ave
- 4937 White Oak Ave
- 4946 Walsh Ave
- 4929 White Oak Ave
- 4941 White Oak Ave
- 4922 Walsh Ave
- 4927 White Oak Ave
- 4943 White Oak Ave
- 4920 Walsh Ave
- 4925 White Oak Ave
- 4931 Walsh Ave
- 4929 Walsh Ave
- 4939 Walsh Ave
- 4918 Walsh Ave