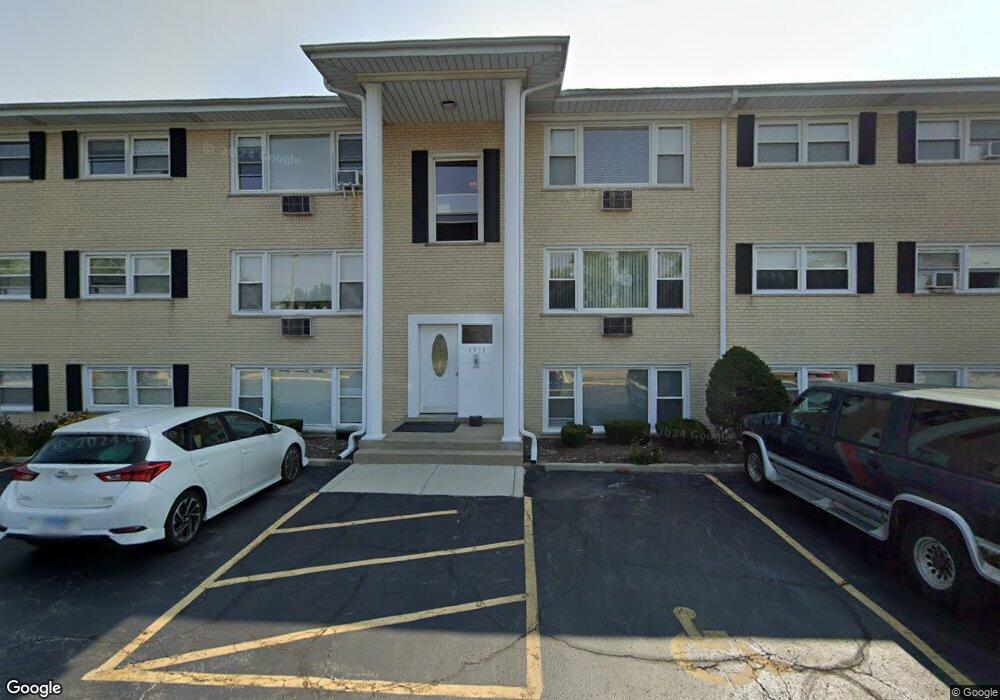
4935 N East River Rd Unit 1A Norridge, IL 60706
Estimated Value: $79,000 - $137,902
1
Bed
1
Bath
350
Sq Ft
$320/Sq Ft
Est. Value
About This Home
This home is located at 4935 N East River Rd Unit 1A, Norridge, IL 60706 and is currently estimated at $111,976, approximately $319 per square foot. 4935 N East River Rd Unit 1A is a home located in Cook County with nearby schools including Pennoyer Elementary School, Ridgewood Community High School, and Brickton Montessori School.
Ownership History
Date
Name
Owned For
Owner Type
Purchase Details
Closed on
Oct 15, 2015
Sold by
Ybanc Inc
Bought by
Ruggiero Salvatore
Current Estimated Value
Purchase Details
Closed on
Jul 22, 2015
Sold by
County Of Cook
Bought by
Ybanc Inc
Purchase Details
Closed on
May 13, 2014
Sold by
Setina Barbara
Bought by
Setina Barbara C and Barbara C Setina Trust
Purchase Details
Closed on
Feb 6, 2012
Sold by
Federal Home Loan Mortgage Corporation
Bought by
Chicago Title Land Trust Company and Trust #800-235-8645
Purchase Details
Closed on
Sep 2, 2011
Sold by
Colorato Loretta
Bought by
Federal Home Loan Mortgage Corporation
Purchase Details
Closed on
May 12, 2005
Sold by
Loulee Inc
Bought by
Colorato Loretta
Home Financials for this Owner
Home Financials are based on the most recent Mortgage that was taken out on this home.
Original Mortgage
$87,500
Interest Rate
6.13%
Mortgage Type
Fannie Mae Freddie Mac
Create a Home Valuation Report for This Property
The Home Valuation Report is an in-depth analysis detailing your home's value as well as a comparison with similar homes in the area
Home Values in the Area
Average Home Value in this Area
Purchase History
| Date | Buyer | Sale Price | Title Company |
|---|---|---|---|
| Ruggiero Salvatore | $55,000 | Stewart Title | |
| Ybanc Inc | -- | Attorney | |
| Setina Barbara C | -- | None Available | |
| Chicago Title Land Trust Company | $25,000 | Attorneys Title Guaranty Fun | |
| Federal Home Loan Mortgage Corporation | -- | None Available | |
| Colorato Loretta | $97,500 | -- |
Source: Public Records
Mortgage History
| Date | Status | Borrower | Loan Amount |
|---|---|---|---|
| Previous Owner | Colorato Loretta | $87,500 |
Source: Public Records
Tax History Compared to Growth
Tax History
| Year | Tax Paid | Tax Assessment Tax Assessment Total Assessment is a certain percentage of the fair market value that is determined by local assessors to be the total taxable value of land and additions on the property. | Land | Improvement |
|---|---|---|---|---|
| 2024 | $1,935 | $7,524 | $906 | $6,618 |
| 2023 | $1,804 | $7,524 | $906 | $6,618 |
| 2022 | $1,804 | $7,524 | $906 | $6,618 |
| 2021 | $1,398 | $5,178 | $661 | $4,517 |
| 2020 | $1,355 | $5,178 | $661 | $4,517 |
| 2019 | $1,337 | $5,765 | $661 | $5,104 |
| 2018 | $998 | $3,700 | $574 | $3,126 |
| 2017 | $975 | $3,700 | $574 | $3,126 |
| 2016 | $920 | $3,700 | $574 | $3,126 |
| 2015 | $793 | $2,943 | $522 | $2,421 |
| 2014 | $780 | $2,943 | $522 | $2,421 |
| 2013 | $764 | $2,943 | $522 | $2,421 |
Source: Public Records
Map
Nearby Homes
- 4938 N Leonard Dr Unit 1B
- 5037 N East River Rd Unit 1B
- 4900 N Ridgewood Ave
- 5117 N East River Rd Unit 1A
- 5143 N East River Rd Unit 152
- 5143 N East River Rd Unit 355
- 5151 N East River Rd Unit 331D
- 5159 N East River Rd Unit 212
- 5159 N East River Rd Unit 307D
- 5159 N East River Rd Unit 105
- 8631 W Foster Ave
- 8542 W Winnemac Ave
- 8517 W Carmen Ave
- 8500 W Carmen Ave
- 8708 W Berwyn Ave Unit 1S
- 8646 W Berwyn Ave Unit 1N
- 8749 W Summerdale Ave Unit 1C
- 8729 W Summerdale Ave
- 8540 W Foster Ave Unit 605
- 8540 W Foster Ave Unit 504
- 4935 N East River Rd Unit 4935
- 4935 N East River Rd Unit 4935
- 4935 N East River Rd Unit 4935
- 4935 N East River Rd Unit 4935
- 4935 N East River Rd Unit 4935
- 4935 N East River Rd Unit 4935
- 4935 N East River Rd Unit 2A
- 4935 N East River Rd Unit 3A
- 4935 N East River Rd Unit 2B
- 4937 N East River Rd Unit 1B
- 4937 N East River Rd Unit 4937
- 4937 N East River Rd Unit 4937
- 4937 N East River Rd Unit 4937
- 4937 N East River Rd Unit 4937
- 4937 N East River Rd Unit 4937
- 4937 N East River Rd Unit 4937
- 4937 N East River Rd Unit 2B
- 4937 N East River Rd Unit 2A
- 4937 N East River Rd Unit 3B
- 4937 N East River Rd Unit 3A