49355 Rockview Way Neskowin, OR 97149
Estimated Value: $599,000 - $950,000
3
Beds
2
Baths
1,876
Sq Ft
$400/Sq Ft
Est. Value
About This Home
This home is located at 49355 Rockview Way, Neskowin, OR 97149 and is currently estimated at $750,764, approximately $400 per square foot. 49355 Rockview Way is a home with nearby schools including Nestucca K-8 School and Nestucca High School.
Create a Home Valuation Report for This Property
The Home Valuation Report is an in-depth analysis detailing your home's value as well as a comparison with similar homes in the area
Home Values in the Area
Average Home Value in this Area
Tax History Compared to Growth
Tax History
| Year | Tax Paid | Tax Assessment Tax Assessment Total Assessment is a certain percentage of the fair market value that is determined by local assessors to be the total taxable value of land and additions on the property. | Land | Improvement |
|---|---|---|---|---|
| 2024 | $5,228 | $418,510 | $137,620 | $280,890 |
| 2023 | $5,241 | $406,330 | $133,610 | $272,720 |
| 2022 | $5,056 | $394,500 | $129,720 | $264,780 |
| 2021 | $4,915 | $383,010 | $125,940 | $257,070 |
| 2020 | $4,769 | $371,860 | $122,270 | $249,590 |
| 2019 | $4,695 | $361,030 | $118,710 | $242,320 |
| 2018 | $4,280 | $350,520 | $115,250 | $235,270 |
| 2017 | $3,839 | $340,320 | $111,900 | $228,420 |
| 2016 | $3,537 | $330,410 | $108,640 | $221,770 |
| 2015 | $3,666 | $320,790 | $105,480 | $215,310 |
| 2014 | $3,566 | $311,450 | $102,410 | $209,040 |
| 2013 | -- | $302,380 | $99,430 | $202,950 |
Source: Public Records
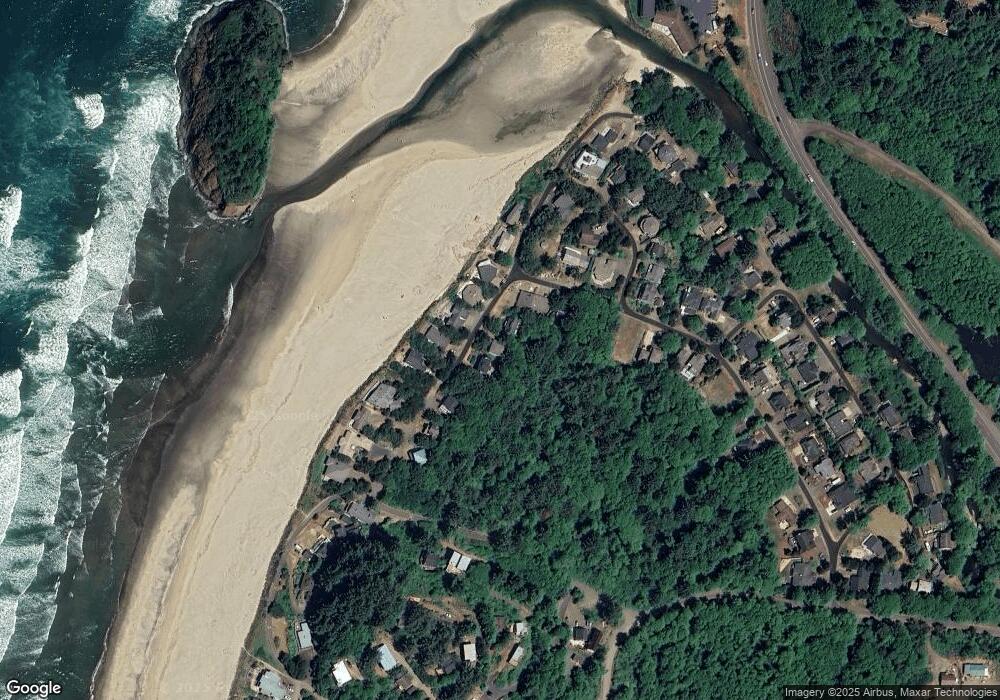
Map
Nearby Homes
- 49400 Blk Nescove Dr Tl303
- 48988 S Highway 101 (#338) Hwy
- 49002 S Hwy
- 49750 Nescove Dr
- TL 3102 S Beach Rd
- 3102 S Beach Rd
- 48988 Highway 101 S
- 48988 Highway 101 S Unit 338
- 48988 Highway 101 S Unit 137-F
- 49855 Seasand Rd
- 50040 S Beach Rd
- 4800 Blk Valley View Dr Tl 4000
- 0 Hilltop Ln Unit 704164730
- 6600 Schoolhouse Rd
- 53000
- 4850 Schoolhouse Rd
- 48250 Hawk St
- 0 S Fairway Rd Unit 653571953
- 0 S Fairway Rd Unit 315656510
- 0 S Fairway Rd Unit 454757988
- 49375 Rockview Way
- 49335 Rockview Way
- 49340 Rockview Way
- 49200 Proposal Rock Loop
- 49330 Rockview Way
- 49360 Rockview Way
- 200 Rockview Way
- 49210 Proposal Rock Loop
- 49330 Proposal Rock Loop
- 49395 Nescove Dr
- 49300 Rockview Way
- 49380 Rockview Way
- 49405 S Beach Rd
- 49190 Proposal Rock Loop
- 49215 Proposal Rock Loop
- 49390 Nescove Ct
- 4550 Blue Heron Ln
- 49110 Proposal Rock Loop
- 4415 Blue Heron Ln
- 4415 Blue Heron Way