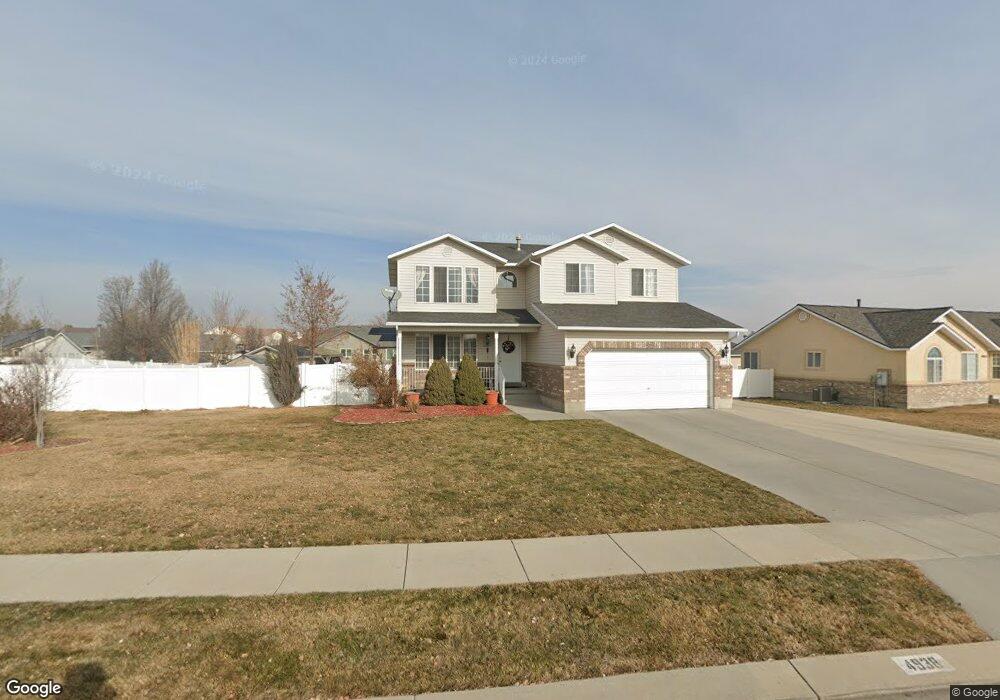
4938 W Mcginnis Ln West Jordan, UT 84081
Copper Hills NeighborhoodEstimated Value: $595,711 - $624,000
3
Beds
4
Baths
2,836
Sq Ft
$215/Sq Ft
Est. Value
About This Home
This home is located at 4938 W Mcginnis Ln, West Jordan, UT 84081 and is currently estimated at $608,928, approximately $214 per square foot. 4938 W Mcginnis Ln is a home located in Salt Lake County with nearby schools including Jordan Hills Elementary School, West Hills Middle School, and Copper Hills High School.
Ownership History
Date
Name
Owned For
Owner Type
Purchase Details
Closed on
Oct 19, 2007
Sold by
Berry Suzanne and Berry Candace
Bought by
Monteiro Alacy M and Monteiro Raquel Q
Current Estimated Value
Home Financials for this Owner
Home Financials are based on the most recent Mortgage that was taken out on this home.
Original Mortgage
$266,945
Outstanding Balance
$168,479
Interest Rate
6.42%
Mortgage Type
FHA
Estimated Equity
$440,449
Purchase Details
Closed on
Jun 25, 1998
Sold by
Berry Utona A
Bought by
Berry Suzanne and Berry Candace
Home Financials for this Owner
Home Financials are based on the most recent Mortgage that was taken out on this home.
Original Mortgage
$156,500
Interest Rate
7.07%
Purchase Details
Closed on
May 20, 1998
Sold by
Harvey Jenkins Construction Inc
Bought by
Berry Utona A and Berry Suzanne
Home Financials for this Owner
Home Financials are based on the most recent Mortgage that was taken out on this home.
Original Mortgage
$156,500
Interest Rate
7.07%
Create a Home Valuation Report for This Property
The Home Valuation Report is an in-depth analysis detailing your home's value as well as a comparison with similar homes in the area
Home Values in the Area
Average Home Value in this Area
Purchase History
| Date | Buyer | Sale Price | Title Company |
|---|---|---|---|
| Monteiro Alacy M | -- | First American Title | |
| Berry Suzanne | -- | -- | |
| Berry Utona A | -- | -- |
Source: Public Records
Mortgage History
| Date | Status | Borrower | Loan Amount |
|---|---|---|---|
| Open | Monteiro Alacy M | $266,945 | |
| Previous Owner | Berry Utona A | $156,500 |
Source: Public Records
Tax History Compared to Growth
Tax History
| Year | Tax Paid | Tax Assessment Tax Assessment Total Assessment is a certain percentage of the fair market value that is determined by local assessors to be the total taxable value of land and additions on the property. | Land | Improvement |
|---|---|---|---|---|
| 2025 | $2,874 | $559,800 | $176,200 | $383,600 |
| 2024 | $2,874 | $552,900 | $174,500 | $378,400 |
| 2023 | $2,874 | $524,800 | $164,600 | $360,200 |
| 2022 | $2,835 | $505,700 | $161,400 | $344,300 |
| 2021 | $2,387 | $387,700 | $125,400 | $262,300 |
| 2020 | $2,231 | $340,000 | $125,400 | $214,600 |
| 2019 | $2,195 | $328,000 | $118,400 | $209,600 |
| 2018 | $2,074 | $307,500 | $118,400 | $189,100 |
| 2017 | $1,890 | $278,900 | $118,400 | $160,500 |
| 2016 | $1,828 | $253,400 | $118,400 | $135,000 |
| 2015 | $1,687 | $228,100 | $125,100 | $103,000 |
| 2014 | $1,548 | $206,000 | $115,000 | $91,000 |
Source: Public Records
Map
Nearby Homes
- 5098 Cherry Laurel Ln
- 4904 Wild Acres Dr
- 4887 W 8620 S
- 9118 S Wisteria Way
- 4624 Pine Crossing Dr
- 9332 S Wild Clover Ln
- 8577 Autumn Gold Cir
- 8854 Rocky Creek Dr
- 4707 W Granada Hills Ct
- 8793 S Big Bar Ct
- 8441 S Spratling Dr
- 7903 Mckenzie Ln
- 7886 Mckenzie Ln
- 8322 Copper Vista Cir
- 5582 Washoe Cove
- 8453 S Windmill Dr
- 8941 S Sun Leaf Dr
- 9353 S 4460 W
- 8359 Etude Dr
- 4565 Lennox Dr
- 4938 Mcginnis Ln
- 4956 Mcginnis Ln
- 4939 Boulder Glen Cir
- 4926 Mcginnis Ln
- 4939 W Boulder Glen Cir
- 4925 Boulder Glen Cir
- 4949 W Boulder Glen Cir
- 4949 Boulder Glen Cir
- 4945 Mcginnis Ln
- 8942 S 4940 W
- 4972 W Mcginnis Ln
- 4972 Mcginnis Ln
- 4963 Mcginnis Ln
- 4924 Boulder Glen Cir
- 4957 Boulder Glen Cir
- 4924 W Boulder
- 4975 Mcginnis Ln
- 8958 S 4940 W
- 8895 Mcginnis Ln
- 4972 Boulder Wash Ln