Estimated Value: $508,000 - $553,000
3
Beds
2
Baths
1,302
Sq Ft
$410/Sq Ft
Est. Value
About This Home
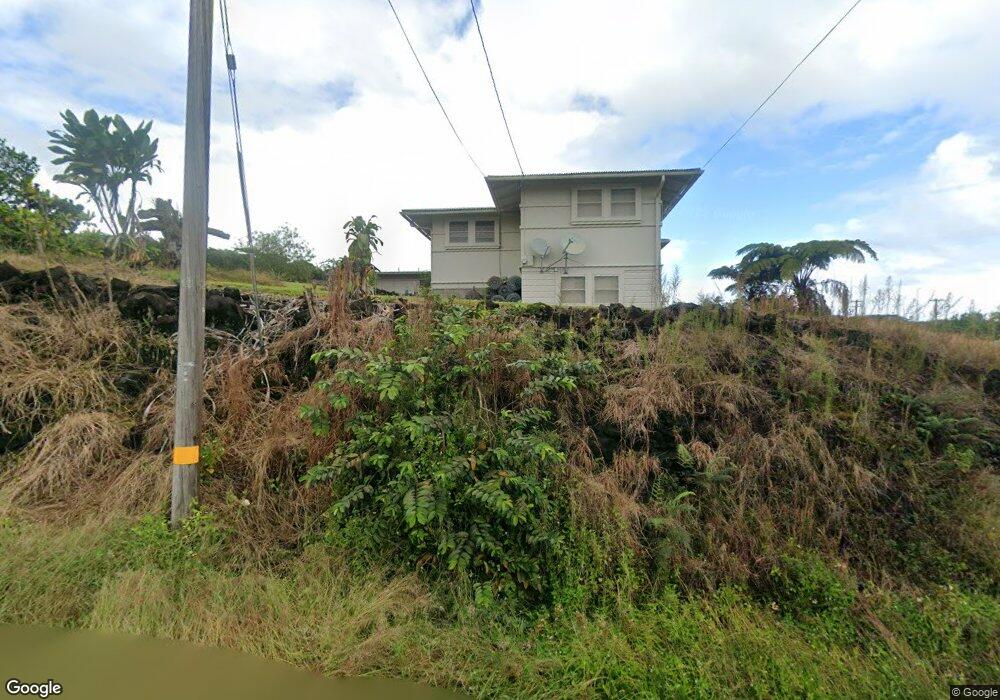
This home is located at 494 Aipuni St, Hilo, HI 96720 and is currently estimated at $533,914, approximately $410 per square foot. 494 Aipuni St is a home with nearby schools including Ernest Bowen de Silva Elementary School, Hilo Intermediate School, and Hilo High School.
Ownership History
Date
Name
Owned For
Owner Type
Purchase Details
Closed on
Feb 24, 2020
Sold by
Murota Eric
Bought by
Murota Eric
Current Estimated Value
Purchase Details
Closed on
Feb 6, 2020
Sold by
Murota Albert K
Bought by
Murota Eric
Purchase Details
Closed on
Dec 3, 2008
Sold by
Browne Lynette Murota
Bought by
Browne Lynette Murota and Betty M Murota Family Trust
Purchase Details
Closed on
Aug 6, 1997
Sold by
Murota Albert K and Murota Betty M
Bought by
Murota Albert K and Murota Betty M
Purchase Details
Closed on
Sep 20, 1996
Sold by
Murota Chiyoko
Bought by
Murota Albert K and Murota Betty M
Create a Home Valuation Report for This Property
The Home Valuation Report is an in-depth analysis detailing your home's value as well as a comparison with similar homes in the area
Home Values in the Area
Average Home Value in this Area
Purchase History
| Date | Buyer | Sale Price | Title Company |
|---|---|---|---|
| Murota Eric | -- | None Available | |
| Murota Eric | -- | None Available | |
| Browne Lynette Murota | -- | None Available | |
| Murota Albert K | -- | -- | |
| Murota Albert K | -- | -- | |
| Murota Chiyoko | -- | -- |
Source: Public Records
Tax History Compared to Growth
Tax History
| Year | Tax Paid | Tax Assessment Tax Assessment Total Assessment is a certain percentage of the fair market value that is determined by local assessors to be the total taxable value of land and additions on the property. | Land | Improvement |
|---|---|---|---|---|
| 2025 | $1,239 | $377,500 | $171,000 | $206,500 |
| 2024 | $1,239 | $366,500 | $171,000 | $195,500 |
| 2023 | $1,228 | $355,800 | $171,000 | $184,800 |
| 2022 | $1,453 | $345,400 | $171,000 | $174,400 |
| 2021 | $1,403 | $335,300 | $171,000 | $164,300 |
| 2020 | $3,447 | $310,500 | $154,500 | $156,000 |
| 2019 | $3,373 | $607,800 | $306,000 | $301,800 |
| 2018 | $2,958 | $266,500 | $145,500 | $121,000 |
| 2017 | $2,906 | $261,800 | $145,500 | $116,300 |
| 2016 | $2,564 | $255,100 | $145,500 | $109,600 |
| 2015 | -- | $224,900 | $125,300 | $99,600 |
| 2014 | -- | $217,400 | $117,200 | $100,200 |
Source: Public Records
Map
Nearby Homes
- 161 Uluwai St
- 61 Pakalana St
- 105 Lahaina St
- 24 Manu Place
- 883 Hele Mauna St
- 617 Ainako Ave Unit 1
- 27 Uluwai St
- 0 Kukuau St Unit 721423
- 199 Kaumana Dr
- 28 S Wiliwili St
- 956 Kaumana Dr
- 7 Kaapuni Loop
- 52 Wawai Loop
- 497 Makanaa St
- 25 Wawai Loop
- 187 Hokulani St
- 901 Kukuau St
- 46 Kokea St
- 55 Omao St
- 144 Chong St