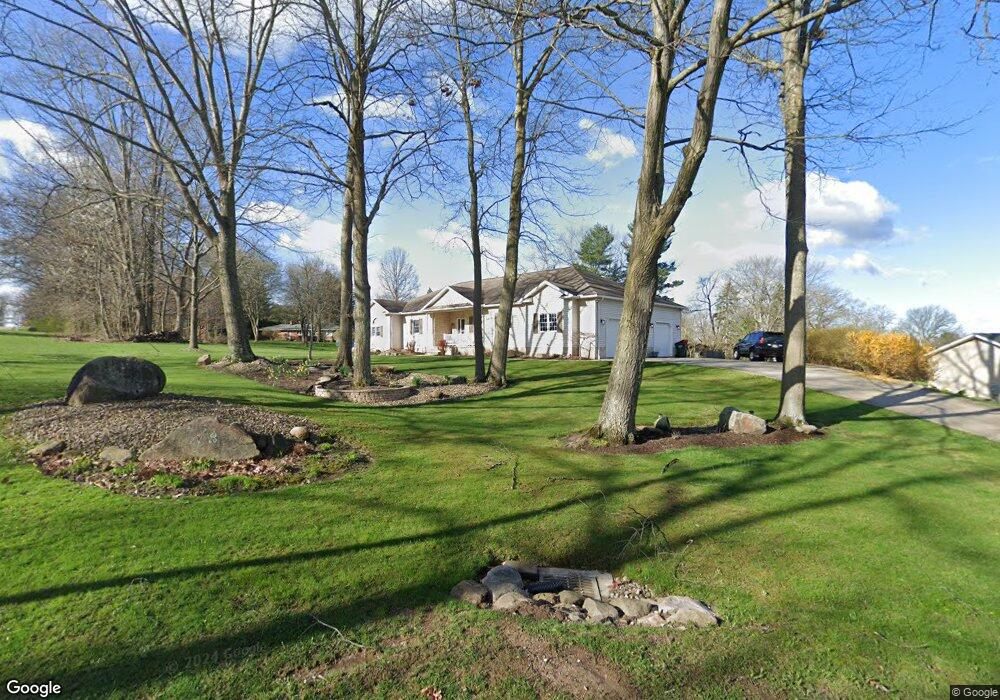
494 Brian Dr Tallmadge, OH 44278
Estimated Value: $321,000 - $453,956
3
Beds
2
Baths
2,211
Sq Ft
$180/Sq Ft
Est. Value
About This Home
This home is located at 494 Brian Dr, Tallmadge, OH 44278 and is currently estimated at $398,489, approximately $180 per square foot. 494 Brian Dr is a home located in Summit County with nearby schools including Tallmadge Middle School, Tallmadge High School, and Steel Academy.
Ownership History
Date
Name
Owned For
Owner Type
Purchase Details
Closed on
Dec 9, 2010
Sold by
Justice Betty J
Bought by
Peters David A and Peters Joni M
Current Estimated Value
Home Financials for this Owner
Home Financials are based on the most recent Mortgage that was taken out on this home.
Original Mortgage
$145,800
Outstanding Balance
$96,327
Interest Rate
4.22%
Mortgage Type
New Conventional
Estimated Equity
$302,162
Purchase Details
Closed on
Apr 21, 1999
Sold by
Justice Richard R and Justice Betty J
Bought by
Peters David A and Peters Joni M
Create a Home Valuation Report for This Property
The Home Valuation Report is an in-depth analysis detailing your home's value as well as a comparison with similar homes in the area
Home Values in the Area
Average Home Value in this Area
Purchase History
| Date | Buyer | Sale Price | Title Company |
|---|---|---|---|
| Peters David A | -- | Attorney | |
| Peters David A | -- | Exchange Place Title Agency |
Source: Public Records
Mortgage History
| Date | Status | Borrower | Loan Amount |
|---|---|---|---|
| Open | Peters David A | $145,800 |
Source: Public Records
Tax History Compared to Growth
Tax History
| Year | Tax Paid | Tax Assessment Tax Assessment Total Assessment is a certain percentage of the fair market value that is determined by local assessors to be the total taxable value of land and additions on the property. | Land | Improvement |
|---|---|---|---|---|
| 2025 | $6,927 | $138,902 | $21,438 | $117,464 |
| 2024 | $6,927 | $138,902 | $21,438 | $117,464 |
| 2023 | $6,927 | $138,902 | $21,438 | $117,464 |
| 2022 | $5,803 | $95,138 | $14,683 | $80,455 |
| 2021 | $5,829 | $95,138 | $14,683 | $80,455 |
| 2020 | $5,783 | $95,140 | $14,680 | $80,460 |
| 2019 | $4,733 | $69,630 | $16,960 | $52,670 |
| 2018 | $4,170 | $69,630 | $16,960 | $52,670 |
| 2017 | $3,586 | $69,630 | $16,960 | $52,670 |
| 2016 | $3,869 | $59,360 | $16,960 | $42,400 |
| 2015 | $3,586 | $59,360 | $16,960 | $42,400 |
| 2014 | $3,562 | $59,360 | $16,960 | $42,400 |
| 2013 | $3,525 | $59,820 | $16,960 | $42,860 |
Source: Public Records
Map
Nearby Homes
- 617 Northeast Ave
- 185 Reserve Dr
- 557 Wring Dr
- 213 Green Hill Dr
- 368 Knollwood Ave
- 313 Southeast Ave
- 532 Beverly Dr
- 353 Southeast Ave
- 0 East Ave
- 0 Northeast Ave Unit 5114314
- 0 North Ave Unit 5116540
- 528 Fernwood Ave
- 243 S Munroe Rd
- 617 North Ave
- 288 S Munroe Rd
- 313 Whittlesey Dr
- 465 Spring Grove Dr
- 130 Strecker Dr
- 211 Cherry Ridge Unit 33
- 278 Smith Dr