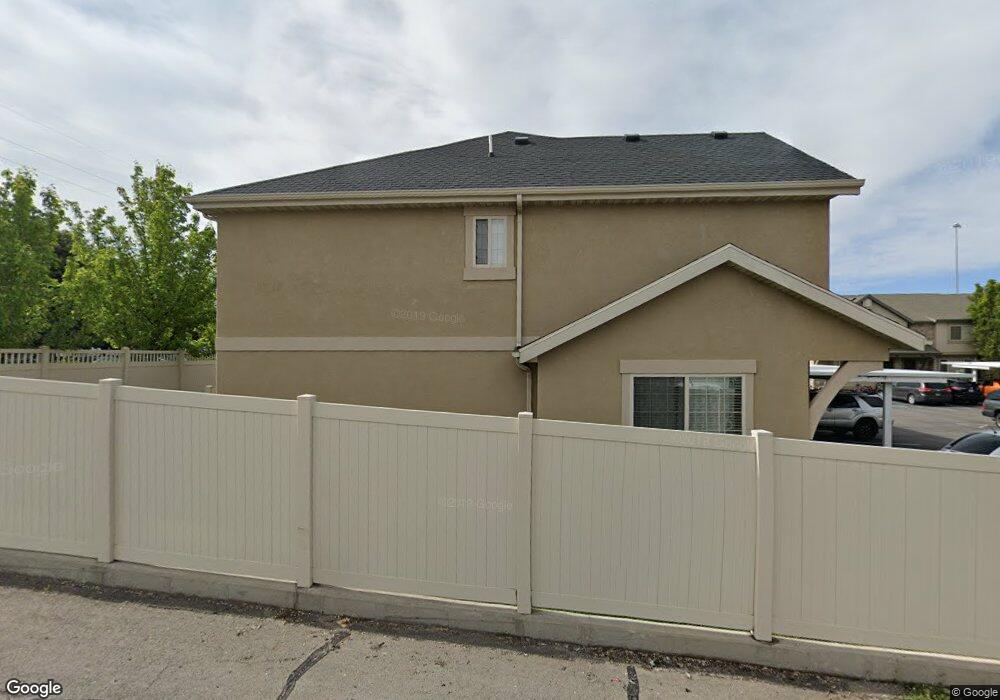
494 N 1235 W Orem, UT 84057
Geneva NeighborhoodEstimated Value: $381,000 - $400,000
3
Beds
3
Baths
1,384
Sq Ft
$280/Sq Ft
Est. Value
About This Home
This home is located at 494 N 1235 W, Orem, UT 84057 and is currently estimated at $387,747, approximately $280 per square foot. 494 N 1235 W is a home located in Utah County with nearby schools including Orem Junior High School, Timpanogos High School, and Franklin Discovery Academy.
Ownership History
Date
Name
Owned For
Owner Type
Purchase Details
Closed on
Jan 17, 2013
Sold by
Bjoralt Kendra Dawn and Bjoralt Shean
Bought by
Gardner Malisalee B
Current Estimated Value
Purchase Details
Closed on
Mar 8, 2011
Sold by
Hansen Kendra D and Bjoralt Kendra Dawn
Bought by
Bjoralt Kendra Dawn and Bjoralt Shean
Home Financials for this Owner
Home Financials are based on the most recent Mortgage that was taken out on this home.
Original Mortgage
$145,949
Interest Rate
4.75%
Mortgage Type
FHA
Create a Home Valuation Report for This Property
The Home Valuation Report is an in-depth analysis detailing your home's value as well as a comparison with similar homes in the area
Home Values in the Area
Average Home Value in this Area
Purchase History
| Date | Buyer | Sale Price | Title Company |
|---|---|---|---|
| Gardner Malisalee B | -- | Inwest Title Services Inc | |
| Bjoralt Kendra Dawn | -- | Inwest Title Services Inc |
Source: Public Records
Mortgage History
| Date | Status | Borrower | Loan Amount |
|---|---|---|---|
| Previous Owner | Bjoralt Kendra Dawn | $145,949 |
Source: Public Records
Tax History
| Year | Tax Paid | Tax Assessment Tax Assessment Total Assessment is a certain percentage of the fair market value that is determined by local assessors to be the total taxable value of land and additions on the property. | Land | Improvement |
|---|---|---|---|---|
| 2025 | $1,641 | $199,430 | -- | -- |
| 2024 | $1,641 | $200,695 | $0 | $0 |
| 2023 | $1,507 | $198,110 | $0 | $0 |
| 2022 | $1,566 | $199,430 | $0 | $0 |
| 2021 | $1,414 | $272,600 | $40,900 | $231,700 |
| 2020 | $1,336 | $253,300 | $38,000 | $215,300 |
| 2019 | $1,213 | $239,100 | $35,900 | $203,200 |
| 2018 | $1,036 | $195,100 | $29,300 | $165,800 |
| 2017 | $900 | $90,750 | $0 | $0 |
| 2016 | $976 | $90,750 | $0 | $0 |
| 2015 | $988 | $86,900 | $0 | $0 |
| 2014 | $948 | $83,050 | $0 | $0 |
Source: Public Records
Map
Nearby Homes
- 454 N 1235 W
- 1094 W 465 N
- 1058 W 570 St N
- 222 N 1200 W Unit 144
- 222 N 1200 W Unit 53
- 222 N 1200 W Unit 84
- 954 W 630 N Unit 34,
- 875 W 530 N
- 686 N 835 W
- 280 N 750 E
- 489 N Beverly Ave
- 266 N 725 E
- 1140 W 950 N Unit D302
- 1140 W 950 N Unit E202
- 1140 W 950 N Unit D304
- 776 W 640 N
- 45 N 970 W
- 206 N 750 E
- 557 N Emery Ave
- 474 N Emery Ave
- 494 N 1235 W Unit 3
- 492 N 1235 W
- 492 N 1235 W Unit 4
- 496 N 1235 W
- 496 N 1235 W Unit 2
- 490 N 1235 W
- 490 N 1235 W Unit 5
- 498 N 1235 W
- 498 N 1235 W Unit 1
- 488 N 1235 W
- 488 N 1235 W Unit 6
- 491 N 1235 W
- 491 N 1235 W Unit 49
- 486 N 1235 W
- 493 N 1235 W
- 493 N 1235 W Unit 51
- 484 N 1235 W
- 484 N 1235 W Unit 8
- 481 N 1235 W
- 495 N 1235 W
Your Personal Tour Guide
Ask me questions while you tour the home.