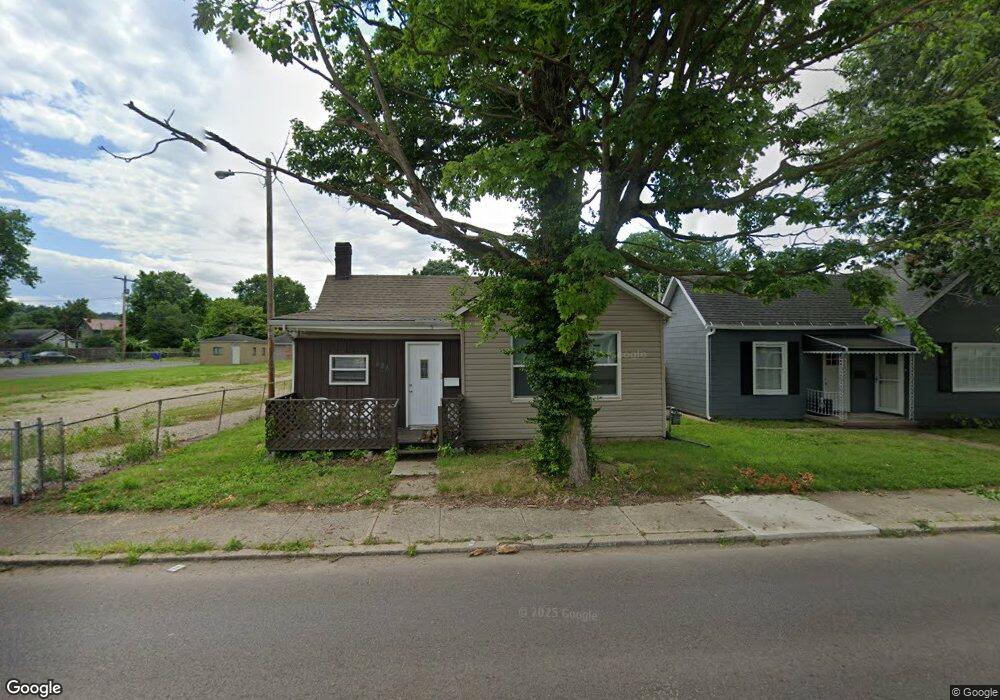
494 N High St Chillicothe, OH 45601
Estimated Value: $68,000 - $146,303
3
Beds
1
Bath
1,203
Sq Ft
$86/Sq Ft
Est. Value
About This Home
This home is located at 494 N High St, Chillicothe, OH 45601 and is currently estimated at $103,326, approximately $85 per square foot. 494 N High St is a home located in Ross County with nearby schools including Chillicothe High School, Bishop Flaget School, and Wesley Taylor Preparatory School.
Ownership History
Date
Name
Owned For
Owner Type
Purchase Details
Closed on
May 22, 2025
Sold by
Yellow Door Investments Llc
Bought by
Yellow Door Investments Company Llc
Current Estimated Value
Purchase Details
Closed on
Feb 19, 2021
Sold by
Reed Michelle and Reed David
Bought by
Honor Property Management Llc
Purchase Details
Closed on
Jun 4, 2020
Sold by
Hamilton Ricky and Hamilton Ricky Lee
Bought by
Reed Michelle and Reed David
Purchase Details
Closed on
Apr 6, 2009
Sold by
Mccormick Robert L
Bought by
Hamilton Ricky Lee
Create a Home Valuation Report for This Property
The Home Valuation Report is an in-depth analysis detailing your home's value as well as a comparison with similar homes in the area
Home Values in the Area
Average Home Value in this Area
Purchase History
| Date | Buyer | Sale Price | Title Company |
|---|---|---|---|
| Yellow Door Investments Company Llc | -- | None Listed On Document | |
| Yellow Door Investments Company Llc | -- | None Listed On Document | |
| Honor Property Management Llc | $38,500 | Northwest Title Family | |
| Reed Michelle | -- | None Available | |
| Hamilton Ricky Lee | -- | Attorney |
Source: Public Records
Tax History Compared to Growth
Tax History
| Year | Tax Paid | Tax Assessment Tax Assessment Total Assessment is a certain percentage of the fair market value that is determined by local assessors to be the total taxable value of land and additions on the property. | Land | Improvement |
|---|---|---|---|---|
| 2024 | $715 | $17,530 | $5,930 | $11,600 |
| 2023 | $727 | $17,530 | $5,930 | $11,600 |
| 2022 | $728 | $17,530 | $5,930 | $11,600 |
| 2021 | $714 | $15,420 | $5,290 | $10,130 |
| 2020 | $714 | $15,420 | $5,290 | $10,130 |
| 2019 | $714 | $15,420 | $5,290 | $10,130 |
| 2018 | $655 | $13,400 | $5,290 | $8,110 |
| 2017 | $234 | $13,190 | $5,290 | $7,900 |
| 2016 | $231 | $13,190 | $5,290 | $7,900 |
| 2015 | $180 | $12,120 | $5,290 | $6,830 |
| 2014 | $651 | $12,120 | $5,290 | $6,830 |
| 2013 | $651 | $12,120 | $5,290 | $6,830 |
Source: Public Records
Map
Nearby Homes