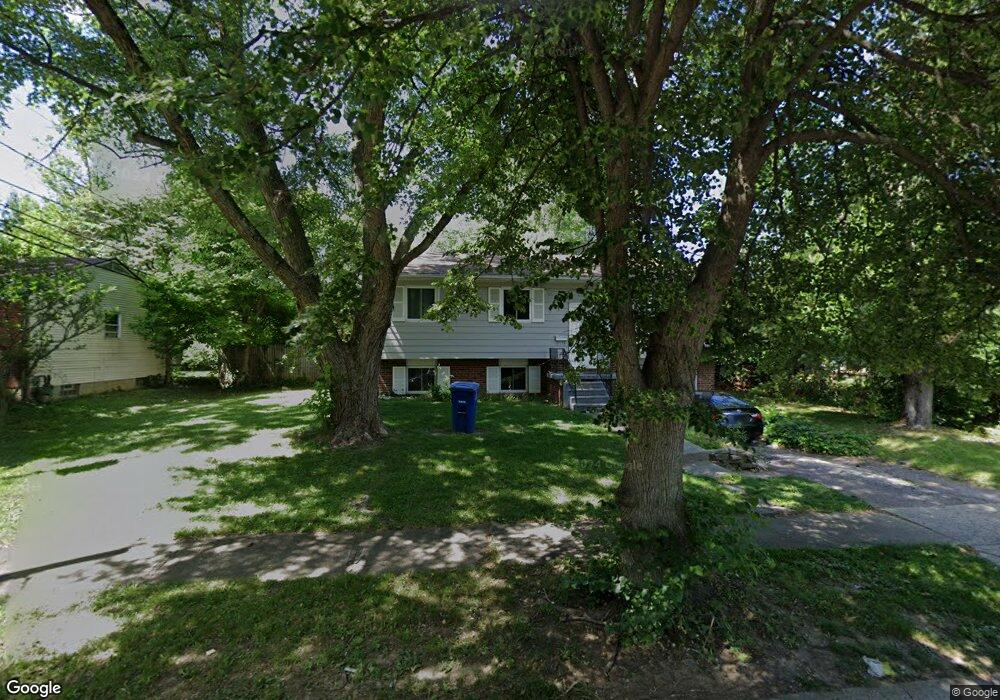
4940 Cryodon Blvd N Columbus, OH 43232
Walnut Heights NeighborhoodEstimated Value: $223,000 - $247,000
3
Beds
2
Baths
1,588
Sq Ft
$146/Sq Ft
Est. Value
About This Home
This home is located at 4940 Cryodon Blvd N, Columbus, OH 43232 and is currently estimated at $231,079, approximately $145 per square foot. 4940 Cryodon Blvd N is a home located in Franklin County with nearby schools including Groveport Madison High School, A+ Arts Academy, and Eastland Preparatory Academy.
Ownership History
Date
Name
Owned For
Owner Type
Purchase Details
Closed on
Mar 8, 2010
Sold by
Steele John A and Steele Jennifer K
Bought by
Oumar Abou
Current Estimated Value
Home Financials for this Owner
Home Financials are based on the most recent Mortgage that was taken out on this home.
Original Mortgage
$55,962
Outstanding Balance
$38,041
Interest Rate
5.5%
Mortgage Type
FHA
Estimated Equity
$193,038
Purchase Details
Closed on
Mar 28, 2006
Sold by
Martin Management Services Inc
Bought by
Steele John A and Steele Jennifer K
Home Financials for this Owner
Home Financials are based on the most recent Mortgage that was taken out on this home.
Original Mortgage
$85,000
Interest Rate
6.34%
Mortgage Type
Fannie Mae Freddie Mac
Purchase Details
Closed on
Jan 28, 1976
Bought by
Clark Samuel A
Create a Home Valuation Report for This Property
The Home Valuation Report is an in-depth analysis detailing your home's value as well as a comparison with similar homes in the area
Home Values in the Area
Average Home Value in this Area
Purchase History
| Date | Buyer | Sale Price | Title Company |
|---|---|---|---|
| Oumar Abou | $57,000 | Talon Group | |
| Steele John A | $85,000 | Talon Group | |
| Clark Samuel A | -- | -- |
Source: Public Records
Mortgage History
| Date | Status | Borrower | Loan Amount |
|---|---|---|---|
| Open | Oumar Abou | $55,962 | |
| Previous Owner | Steele John A | $85,000 |
Source: Public Records
Tax History Compared to Growth
Tax History
| Year | Tax Paid | Tax Assessment Tax Assessment Total Assessment is a certain percentage of the fair market value that is determined by local assessors to be the total taxable value of land and additions on the property. | Land | Improvement |
|---|---|---|---|---|
| 2024 | $2,845 | $67,100 | $18,690 | $48,410 |
| 2023 | $2,818 | $67,095 | $18,690 | $48,405 |
| 2022 | $1,771 | $35,070 | $7,350 | $27,720 |
| 2021 | $1,776 | $35,070 | $7,350 | $27,720 |
| 2020 | $1,779 | $35,070 | $7,350 | $27,720 |
| 2019 | $1,666 | $29,370 | $6,130 | $23,240 |
| 2018 | $1,633 | $29,370 | $6,130 | $23,240 |
| 2017 | $1,627 | $29,370 | $6,130 | $23,240 |
| 2016 | $1,572 | $25,100 | $5,080 | $20,020 |
| 2015 | $1,589 | $25,100 | $5,080 | $20,020 |
| 2014 | $1,607 | $25,100 | $5,080 | $20,020 |
| 2013 | $747 | $27,860 | $5,635 | $22,225 |
Source: Public Records
Map
Nearby Homes
- 4906 Refugee Rd
- 5011 Refugee Rd
- 2615 Carbondale Place
- 2901 Renfro Rd
- 2746 Noe Bixby Rd
- 5137 Holbrook Dr
- 2900 Ronda Rd
- 5125 Upton Rd N
- 2342 Noe Bixby Rd
- 2336 Noe Bixby Rd
- 2360 Noe Bixby Rd
- 2354 Noe Bixby Rd
- 2348 Noe Bixby Rd
- 2150 Noe Bixby Rd
- 2705 Denmark Rd
- 2998 Osgood Rd E
- 5114 Carbondale Dr
- 2651 Brownfield Rd
- 5143 Rutledge Dr N
- 5278 Glenbriar Ct
- 4934 Cryodon Blvd N
- 2749 Maywood Rd
- 4926 Cryodon Blvd N
- 4925 Refugee Rd
- 4933 Refugee Rd
- 4917 Refugee Rd
- 4947 Cryodon Blvd N
- 4933 Cryodon Blvd N
- 4933 Croydon Blvd
- 2735 Maywood Rd
- 4918 Cryodon Blvd N
- 4909 Refugee Rd
- 2775 Maywood Rd
- 2752 Maywood Rd
- 4901 Refugee Rd
- 2768 Halifax Ct
- 2772 Maywood Rd
- 4910 Cryodon Blvd N
- 2783 Maywood Rd
- 4893 Refugee Rd