Estimated Value: $467,734 - $505,000
5
Beds
3
Baths
2,119
Sq Ft
$230/Sq Ft
Est. Value
About This Home
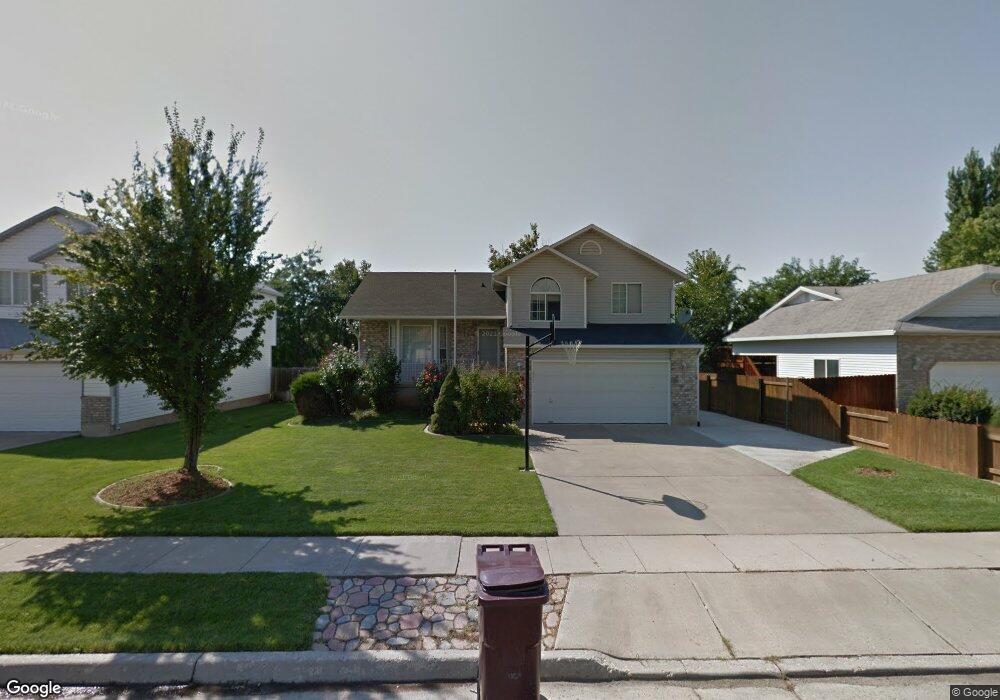
This home is located at 4941 S 3000 W, Roy, UT 84067 and is currently estimated at $487,684, approximately $230 per square foot. 4941 S 3000 W is a home located in Weber County with nearby schools including Midland School, Sand Ridge Junior High School, and Roy High School.
Ownership History
Date
Name
Owned For
Owner Type
Purchase Details
Closed on
Nov 18, 2009
Sold by
Wohlschlegel Greg L
Bought by
Mlaka Michael
Current Estimated Value
Home Financials for this Owner
Home Financials are based on the most recent Mortgage that was taken out on this home.
Original Mortgage
$193,000
Outstanding Balance
$124,921
Interest Rate
4.83%
Mortgage Type
VA
Estimated Equity
$362,763
Purchase Details
Closed on
Sep 23, 1997
Sold by
Watkins Margie A and Watkins Robert P
Bought by
Wohlschlegel Greg L
Home Financials for this Owner
Home Financials are based on the most recent Mortgage that was taken out on this home.
Original Mortgage
$108,000
Interest Rate
7.54%
Create a Home Valuation Report for This Property
The Home Valuation Report is an in-depth analysis detailing your home's value as well as a comparison with similar homes in the area
Home Values in the Area
Average Home Value in this Area
Purchase History
| Date | Buyer | Sale Price | Title Company |
|---|---|---|---|
| Mlaka Michael | -- | Mountain View Title Ogden | |
| Wohlschlegel Greg L | -- | Associated Title |
Source: Public Records
Mortgage History
| Date | Status | Borrower | Loan Amount |
|---|---|---|---|
| Open | Mlaka Michael | $193,000 | |
| Previous Owner | Wohlschlegel Greg L | $108,000 |
Source: Public Records
Tax History
| Year | Tax Paid | Tax Assessment Tax Assessment Total Assessment is a certain percentage of the fair market value that is determined by local assessors to be the total taxable value of land and additions on the property. | Land | Improvement |
|---|---|---|---|---|
| 2025 | $2,379 | $467,802 | $133,568 | $334,234 |
| 2024 | $2,274 | $247,499 | $73,462 | $174,037 |
| 2023 | $2,593 | $229,350 | $66,744 | $162,606 |
| 2022 | $2,837 | $260,150 | $56,177 | $203,973 |
| 2021 | $2,234 | $335,000 | $76,581 | $258,419 |
| 2020 | $2,152 | $297,000 | $76,581 | $220,419 |
| 2019 | $2,100 | $273,000 | $46,323 | $226,677 |
| 2018 | $2,010 | $246,000 | $46,323 | $199,677 |
| 2017 | $1,824 | $208,000 | $46,323 | $161,677 |
| 2016 | $1,782 | $109,442 | $22,430 | $87,012 |
| 2015 | $1,582 | $98,821 | $22,430 | $76,391 |
| 2014 | $1,569 | $96,913 | $22,430 | $74,483 |
Source: Public Records
Map
Nearby Homes
- 5009 S 2925 W
- 4891 S 2875 W
- 5063 S 2825 W
- 2817 W 5000 S
- 4793 S 3025 W
- 5141 S 2975 W
- 3022 W 4750 S
- 5155 S 3200 W
- 2953 W 4650 S
- 4732 S West Park Dr
- 5304 S 3100 W
- 2581 W 5000 S
- 5321 S 3100 W
- 5125 S 2600 W
- 2568 W 5225 S
- 5421 S 2775 W
- 2602 W 4600 S
- 3443 W 5200 S Unit 2&3
- 3509 W 4835 S Unit 26
- 3517 W 4835 S Unit 27
Your Personal Tour Guide
Ask me questions while you tour the home.