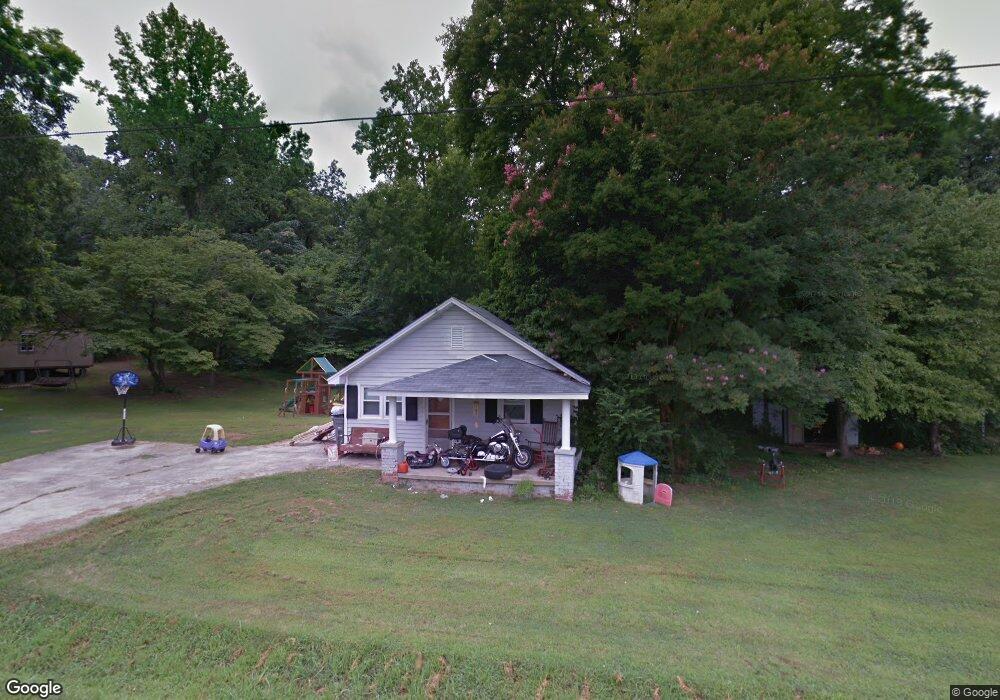
4941 Tucker Ave Unit 5,6 Kannapolis, NC 28081
Estimated Value: $181,000 - $235,423
2
Beds
1
Bath
1,078
Sq Ft
$199/Sq Ft
Est. Value
About This Home
This home is located at 4941 Tucker Ave Unit 5,6, Kannapolis, NC 28081 and is currently estimated at $214,856, approximately $199 per square foot. 4941 Tucker Ave Unit 5,6 is a home located in Cabarrus County with nearby schools including Fred L. Wilson Elementary School, Kannapolis Middle, and A.L. Brown High School.
Ownership History
Date
Name
Owned For
Owner Type
Purchase Details
Closed on
Jul 17, 2019
Sold by
Eddie Annette Cathy L and Eddie Annette
Bought by
Killmeyer Rachael
Current Estimated Value
Home Financials for this Owner
Home Financials are based on the most recent Mortgage that was taken out on this home.
Original Mortgage
$103,305
Outstanding Balance
$90,504
Interest Rate
3.82%
Mortgage Type
New Conventional
Estimated Equity
$124,352
Purchase Details
Closed on
May 2, 2016
Sold by
Deese Roger V
Bought by
Deese Cathy L
Purchase Details
Closed on
Jul 31, 2007
Sold by
Deese Roger V and Deese Cathy L
Bought by
Deese Roger and Deese Cathy L
Home Financials for this Owner
Home Financials are based on the most recent Mortgage that was taken out on this home.
Original Mortgage
$49,000
Interest Rate
6.63%
Mortgage Type
Stand Alone Refi Refinance Of Original Loan
Purchase Details
Closed on
Dec 1, 1990
Bought by
Deese Roger
Purchase Details
Closed on
Sep 1, 1985
Create a Home Valuation Report for This Property
The Home Valuation Report is an in-depth analysis detailing your home's value as well as a comparison with similar homes in the area
Home Values in the Area
Average Home Value in this Area
Purchase History
| Date | Buyer | Sale Price | Title Company |
|---|---|---|---|
| Killmeyer Rachael | $106,500 | None Available | |
| Deese Cathy L | -- | None Available | |
| Deese Roger | -- | First American Title Ins Co | |
| Deese Roger | $38,500 | -- | |
| -- | $35,000 | -- |
Source: Public Records
Mortgage History
| Date | Status | Borrower | Loan Amount |
|---|---|---|---|
| Open | Killmeyer Rachael | $103,305 | |
| Previous Owner | Deese Roger | $49,000 |
Source: Public Records
Tax History Compared to Growth
Tax History
| Year | Tax Paid | Tax Assessment Tax Assessment Total Assessment is a certain percentage of the fair market value that is determined by local assessors to be the total taxable value of land and additions on the property. | Land | Improvement |
|---|---|---|---|---|
| 2025 | $2,212 | $194,790 | $88,270 | $106,520 |
| 2024 | $2,212 | $194,790 | $88,270 | $106,520 |
| 2023 | $1,427 | $104,160 | $43,450 | $60,710 |
| 2022 | $1,427 | $104,160 | $43,450 | $60,710 |
| 2021 | $1,427 | $104,160 | $43,450 | $60,710 |
| 2020 | $1,427 | $104,160 | $43,450 | $60,710 |
| 2019 | $1,215 | $88,700 | $36,660 | $52,040 |
| 2018 | $1,197 | $88,700 | $36,660 | $52,040 |
| 2017 | $1,180 | $88,700 | $36,660 | $52,040 |
| 2016 | $1,180 | $80,630 | $27,160 | $53,470 |
| 2015 | $1,016 | $80,630 | $27,160 | $53,470 |
| 2014 | $1,016 | $80,630 | $27,160 | $53,470 |
Source: Public Records
Map
Nearby Homes
- 4820 Mooresville Rd
- 4601 Mooresville Rd
- 1599 Bethpage Rd
- 5453 S Oakmont St
- 5461 S Oakmont St
- 4404 Dusty Orchard Rd
- 4415 Dusty Orchard Rd
- 4400 Dusty Orchard Rd
- 5445 Mooresville Rd
- Pine End Home Plan at Cherry Grove Townhomes
- Pine Plan at Cherry Grove Townhomes
- Juniper Plan at Cherry Grove Townhomes
- 5760 Granbury Dr
- 5770 Granbury Dr
- 5682 Knox Ln Unit D
- 5722 Knox Ln
- 5860 Granbury Dr
- 5742 Knox Ln
- 5752 Knox Ln
- 5870 Granbury Dr
- 4941 Tucker Ave
- 5001 Tucker Ave
- 4930 Tucker Ave
- 4923 Tucker Ave
- 5000 Tucker Ave
- 5015 Tucker Ave
- 5015 Tucker Ave
- 5020 Tucker Ave
- 5141 Isenhour Rd
- 4901 Tucker Ave
- 5043 Tucker Ave Unit 5
- 5043 Tucker Ave
- 4908 Tucker Ave
- 5200 Tucker Ave
- 5200 Isenhour Ave
- 4739 Tucker Ave
- 5110 Tucker Ave
- 5145 Tucker Ave
- 5211 Isenhour Ave
- 5135 Tucker Ave