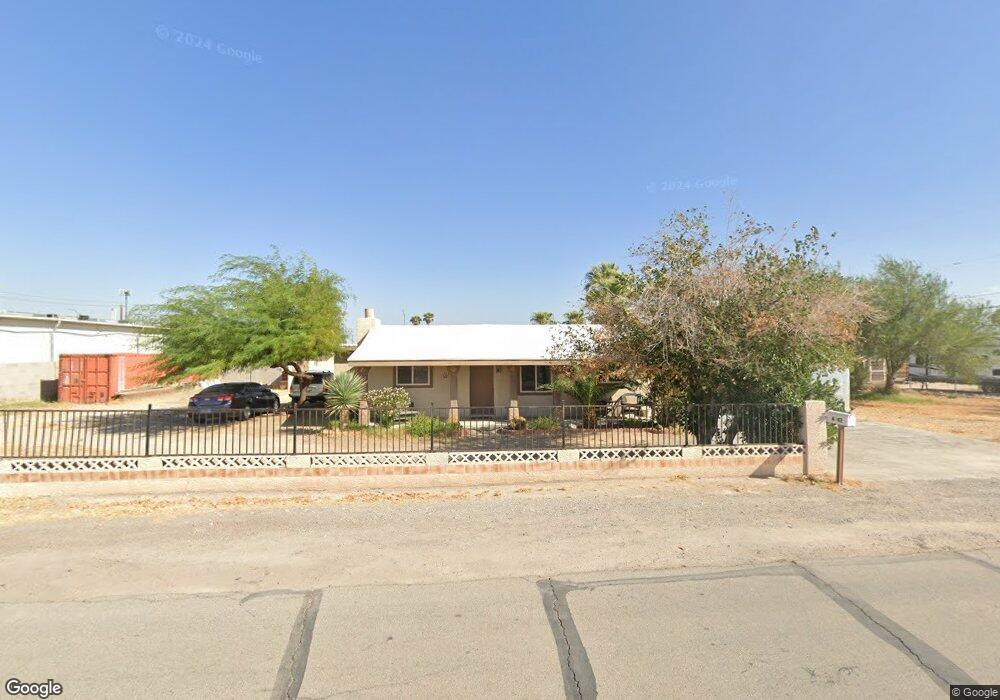
4942 Titanium Ave Las Vegas, NV 89120
Paradise Valley East NeighborhoodEstimated Value: $363,116 - $401,000
3
Beds
1
Bath
1,164
Sq Ft
$329/Sq Ft
Est. Value
About This Home
This home is located at 4942 Titanium Ave, Las Vegas, NV 89120 and is currently estimated at $382,779, approximately $328 per square foot. 4942 Titanium Ave is a home located in Clark County with nearby schools including Bill Y. Tomiyasu Elementary School, Helen C. Cannon Junior High School, and Del Sol Academy of the Performing Arts.
Ownership History
Date
Name
Owned For
Owner Type
Purchase Details
Closed on
Apr 1, 2014
Sold by
Hedge Thomas J and Sagan Julia A
Bought by
Hedge Living Trust
Current Estimated Value
Purchase Details
Closed on
Apr 16, 2003
Sold by
Hedge Thomas J and Sagan Julia A
Bought by
Hedge Thomas J and Sagan Julia A
Home Financials for this Owner
Home Financials are based on the most recent Mortgage that was taken out on this home.
Original Mortgage
$105,000
Outstanding Balance
$44,610
Interest Rate
5.6%
Estimated Equity
$338,169
Purchase Details
Closed on
Sep 18, 2001
Sold by
Huerta Marcy E
Bought by
Christy Lorretta S
Purchase Details
Closed on
Feb 11, 1999
Sold by
Holley Otis B and Holley Virtie C
Bought by
Hedge Thomas J and Sagan Julia A
Home Financials for this Owner
Home Financials are based on the most recent Mortgage that was taken out on this home.
Original Mortgage
$97,578
Interest Rate
6.76%
Mortgage Type
FHA
Create a Home Valuation Report for This Property
The Home Valuation Report is an in-depth analysis detailing your home's value as well as a comparison with similar homes in the area
Home Values in the Area
Average Home Value in this Area
Purchase History
| Date | Buyer | Sale Price | Title Company |
|---|---|---|---|
| Hedge Living Trust | -- | None Available | |
| Hedge Thomas J | -- | Fidelity National Title | |
| Christy Lorretta S | $35,000 | Land Title | |
| Hedge Thomas J | $99,000 | Stewart Title |
Source: Public Records
Mortgage History
| Date | Status | Borrower | Loan Amount |
|---|---|---|---|
| Open | Hedge Thomas J | $105,000 | |
| Previous Owner | Hedge Thomas J | $97,578 |
Source: Public Records
Tax History Compared to Growth
Tax History
| Year | Tax Paid | Tax Assessment Tax Assessment Total Assessment is a certain percentage of the fair market value that is determined by local assessors to be the total taxable value of land and additions on the property. | Land | Improvement |
|---|---|---|---|---|
| 2025 | $705 | $60,080 | $44,625 | $15,455 |
| 2024 | $685 | $60,080 | $44,625 | $15,455 |
| 2023 | $718 | $58,641 | $44,625 | $14,016 |
| 2022 | $697 | $40,469 | $28,000 | $12,469 |
| 2021 | $646 | $34,022 | $22,400 | $11,622 |
| 2020 | $624 | $30,906 | $19,600 | $11,306 |
| 2019 | $616 | $30,472 | $19,600 | $10,872 |
| 2018 | $588 | $29,802 | $19,600 | $10,202 |
| 2017 | $789 | $26,911 | $16,800 | $10,111 |
| 2016 | $558 | $22,997 | $14,700 | $8,297 |
| 2015 | $556 | $21,720 | $12,250 | $9,470 |
| 2014 | $539 | $17,817 | $12,250 | $5,567 |
Source: Public Records
Map
Nearby Homes
- 4845 S Mountain Vista St
- 4647 Mill Valley Dr
- 4462 Newton Dr
- 4715 Mill Valley Dr
- 5078 Mountain Vista St
- 4457 Rita Dr
- 5086 Mountain Vista St
- 4676 Tamalpias Ave
- 4345 Quay Ct Unit 5
- 4655 Bennett Dr
- 4674 Petaluma Cir
- 4567 Dennis Way
- 4805 Terra Linda Ave
- 4332 Del Santos Dr
- 4310 El Antonio Place
- 4727 Conrad St
- 4285 El Como Way
- 4129 Ridgewood Ave
- 5239 Somerset Dr
- 4754 Marnell Dr
- 4943 Merrill Ave
- 4923 Titanium Ave
- 4966 Titanium Ave
- 4967 Merrill Ave
- 4967 Titanium Ave
- 4942 Pearlite Ave
- 4575 E Tropicana Ave
- 4991 Merrill Ave
- 4991 Titanium Ave
- 4988 Pearlite Ave
- 4990 Pearlite Ave
- 5014 Titanium Ave
- 5015 Merrill Ave
- 5015 Titanium Ave
- 5014 Merrill Ave
- 4578 Tulipan Way
- 4990 Philmar Ave
- 4594 Tulipan Way
- 5038 Titanium Ave
- 5039 Merrill Ave