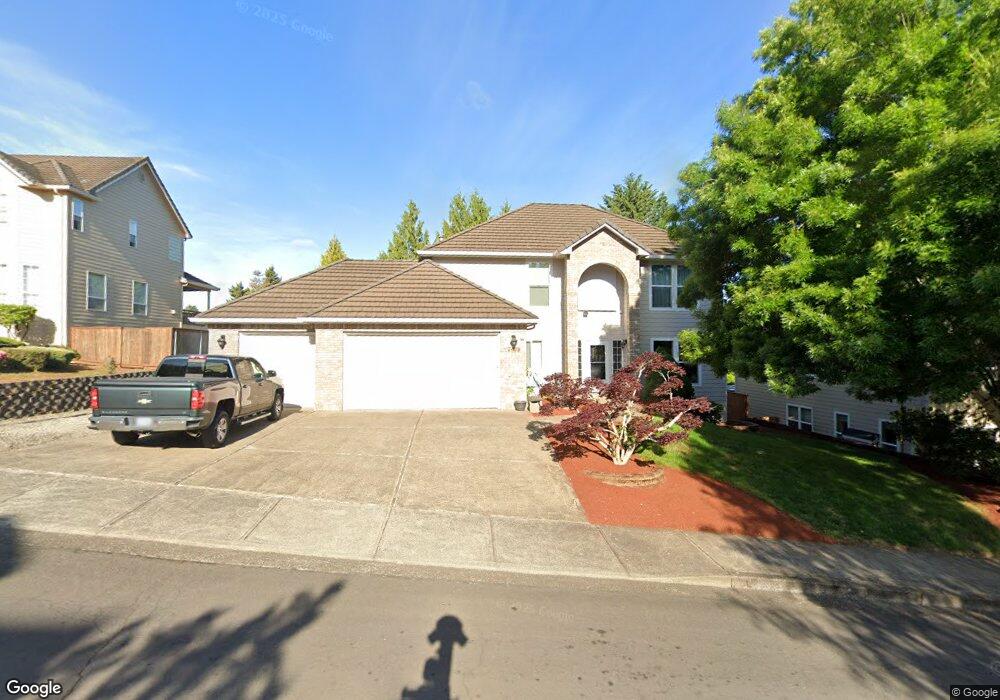
4943 Albion Ct SE Salem, OR 97302
Morningside NeighborhoodEstimated Value: $633,526 - $784,000
4
Beds
3
Baths
2,374
Sq Ft
$294/Sq Ft
Est. Value
About This Home
This home is located at 4943 Albion Ct SE, Salem, OR 97302 and is currently estimated at $697,382, approximately $293 per square foot. 4943 Albion Ct SE is a home located in Marion County with nearby schools including Pringle Elementary School, Judson Middle School, and South Salem High School.
Ownership History
Date
Name
Owned For
Owner Type
Purchase Details
Closed on
Mar 7, 2012
Sold by
Sevdy John C and Sevdy Barbara J
Bought by
Sevdy John C and Sevdy Barbara J
Current Estimated Value
Purchase Details
Closed on
Nov 1, 2005
Sold by
Bradley Virgil L and Bradley Connie R
Bought by
Sevdy John C and Sevdy Barbara J
Home Financials for this Owner
Home Financials are based on the most recent Mortgage that was taken out on this home.
Original Mortgage
$180,000
Interest Rate
5.74%
Mortgage Type
Fannie Mae Freddie Mac
Purchase Details
Closed on
Jul 18, 2003
Sold by
Tran Hung D and Huynh Hoa L
Bought by
Bradley Virgil L and Bradley Connie R
Home Financials for this Owner
Home Financials are based on the most recent Mortgage that was taken out on this home.
Original Mortgage
$223,900
Interest Rate
5.15%
Mortgage Type
Purchase Money Mortgage
Create a Home Valuation Report for This Property
The Home Valuation Report is an in-depth analysis detailing your home's value as well as a comparison with similar homes in the area
Home Values in the Area
Average Home Value in this Area
Purchase History
| Date | Buyer | Sale Price | Title Company |
|---|---|---|---|
| Sevdy John C | -- | None Available | |
| Sevdy John C | $359,900 | Fidelity National Title | |
| Bradley Virgil L | $279,900 | Multiple |
Source: Public Records
Mortgage History
| Date | Status | Borrower | Loan Amount |
|---|---|---|---|
| Closed | Sevdy John C | $180,000 | |
| Closed | Sevdy John C | $161,905 | |
| Previous Owner | Bradley Virgil L | $223,900 | |
| Closed | Bradley Virgil L | $41,950 |
Source: Public Records
Tax History Compared to Growth
Tax History
| Year | Tax Paid | Tax Assessment Tax Assessment Total Assessment is a certain percentage of the fair market value that is determined by local assessors to be the total taxable value of land and additions on the property. | Land | Improvement |
|---|---|---|---|---|
| 2025 | $8,113 | $425,610 | -- | -- |
| 2024 | $8,113 | $413,220 | -- | -- |
| 2023 | $7,874 | $401,190 | $0 | $0 |
| 2022 | $7,424 | $389,510 | $0 | $0 |
| 2021 | $7,212 | $378,170 | $0 | $0 |
| 2020 | $7,002 | $367,160 | $0 | $0 |
| 2019 | $6,756 | $356,470 | $0 | $0 |
| 2018 | $6,875 | $0 | $0 | $0 |
| 2017 | $6,205 | $0 | $0 | $0 |
| 2016 | $5,910 | $0 | $0 | $0 |
| 2015 | $5,955 | $0 | $0 | $0 |
| 2014 | $5,210 | $0 | $0 | $0 |
Source: Public Records
Map
Nearby Homes
- 4943 Southampton Dr SE
- 4797 Constitution Ave SE
- 1532 Webster Dr SE
- 4586 Constitution Ave SE
- 2175 Churchill Ave SE
- 4697 Southampton Dr SE
- 5065 Barnes Ct SE
- 1918 Riting Ct SE
- 2259 Alex Ct SE
- 1615 Harlandale Ave SE
- 2023 Lone Fir Ct SE
- 1540 Harlandale Ave SE
- 4540 Sunland St SE
- 4417 Battle Creek Rd SE
- 4535 Sunland St SE
- 2324 Thrush Ct SE
- 5447 Sugar Plum St SE
- 5095 Cultus Ave SE
- 5173 Fort Rock Ave SE
- 5247 Baxter Ct SE Unit 5249
- 4923 Albion Ct SE
- 4963 Albion Ct SE
- 4946 Kinsington St SE
- 4926 Kinsington St SE
- 4966 Kinsington St SE
- 4950 Albion Ct SE
- 4930 Albion Ct SE
- 4903 Albion Ct SE
- 4983 Albion Ct SE
- 4970 Albion Ct SE
- 4906 Kinsington St SE
- 1930 Wickshire Ave SE
- 4986 Kinsington St SE
- 4990 Albion Ct SE
- 4955 Chauncey Ct SE
- 4935 Chauncey Ct SE
- 4949 Kinsington St SE
- 4975 Chauncey Ct SE
- 4969 Kinsington St SE
- 4929 Kinsington St SE