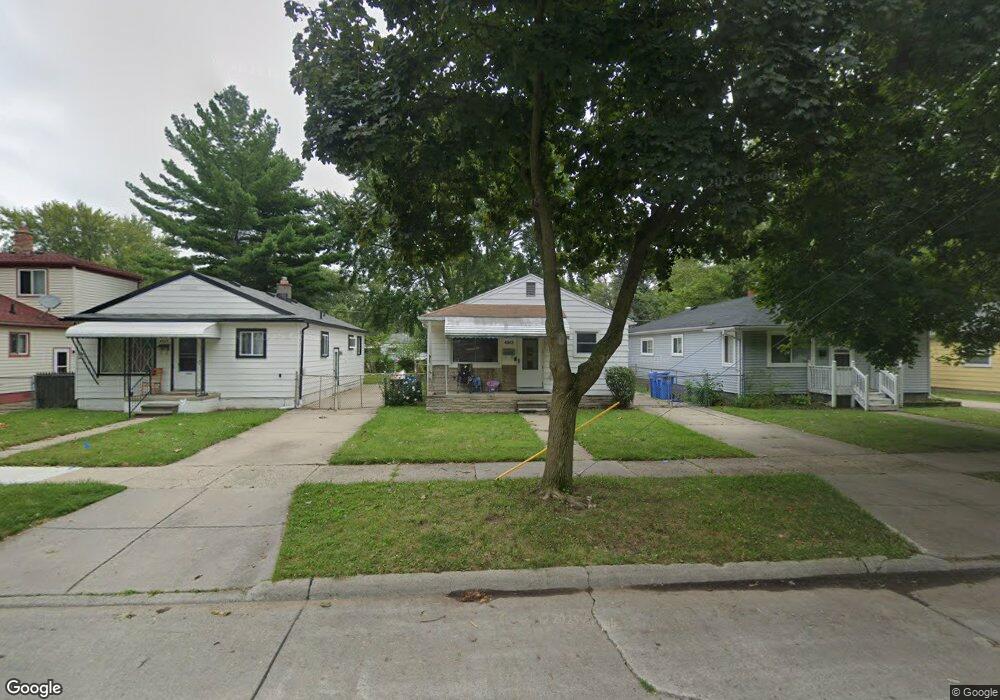
4943 Katherine St Dearborn Heights, MI 48125
Estimated Value: $144,737 - $176,000
3
Beds
1
Bath
936
Sq Ft
$170/Sq Ft
Est. Value
About This Home
This home is located at 4943 Katherine St, Dearborn Heights, MI 48125 and is currently estimated at $158,684, approximately $169 per square foot. 4943 Katherine St is a home located in Wayne County with nearby schools including Polk Elementary School, Bedford School, and Pardee School.
Ownership History
Date
Name
Owned For
Owner Type
Purchase Details
Closed on
Jan 18, 2008
Sold by
Kowalewski Alan J
Bought by
Kowalewski Alan J
Current Estimated Value
Home Financials for this Owner
Home Financials are based on the most recent Mortgage that was taken out on this home.
Original Mortgage
$61,000
Outstanding Balance
$38,524
Interest Rate
6.17%
Mortgage Type
Stand Alone Refi Refinance Of Original Loan
Estimated Equity
$120,160
Purchase Details
Closed on
Dec 11, 2006
Sold by
Hud
Bought by
Kowaleski Alan
Purchase Details
Closed on
May 4, 2006
Sold by
M & T Mortgage Corp
Bought by
Hud
Purchase Details
Closed on
Nov 2, 2005
Sold by
Kwilas Robert and Kwilas Cheri
Bought by
M & T Mortgage Corp
Purchase Details
Closed on
Oct 31, 2000
Sold by
Montgomery Jeffrey A
Bought by
Kwilas Cheri
Purchase Details
Closed on
May 14, 1998
Sold by
Shrf Cathy A Jackson Pr
Bought by
Housing Dev Johnette E Lytle & Michigan State
Create a Home Valuation Report for This Property
The Home Valuation Report is an in-depth analysis detailing your home's value as well as a comparison with similar homes in the area
Home Values in the Area
Average Home Value in this Area
Purchase History
| Date | Buyer | Sale Price | Title Company |
|---|---|---|---|
| Kowalewski Alan J | -- | Metropolitan Title Company | |
| Kowaleski Alan | $62,000 | None Available | |
| Hud | -- | None Available | |
| M & T Mortgage Corp | $105,587 | None Available | |
| Kwilas Cheri | $93,000 | -- | |
| Housing Dev Johnette E Lytle & Michigan State | $55,571 | -- |
Source: Public Records
Mortgage History
| Date | Status | Borrower | Loan Amount |
|---|---|---|---|
| Open | Kowalewski Alan J | $61,000 |
Source: Public Records
Tax History Compared to Growth
Tax History
| Year | Tax Paid | Tax Assessment Tax Assessment Total Assessment is a certain percentage of the fair market value that is determined by local assessors to be the total taxable value of land and additions on the property. | Land | Improvement |
|---|---|---|---|---|
| 2025 | $1,441 | $63,000 | $0 | $0 |
| 2024 | $1,441 | $56,300 | $0 | $0 |
| 2023 | $1,364 | $49,500 | $0 | $0 |
| 2022 | $2,032 | $42,500 | $0 | $0 |
| 2021 | $2,017 | $36,700 | $0 | $0 |
| 2019 | $1,945 | $31,700 | $0 | $0 |
| 2018 | $1,223 | $27,300 | $0 | $0 |
| 2017 | $1,348 | $26,400 | $0 | $0 |
| 2016 | $1,857 | $26,200 | $0 | $0 |
| 2015 | $2,510 | $25,100 | $0 | $0 |
| 2013 | $2,560 | $26,700 | $0 | $0 |
| 2010 | -- | $32,500 | $0 | $0 |
Source: Public Records
Map
Nearby Homes
- 21334 Powers Ave
- 5373 Katherine St
- 4620 Katherine St
- 21302 Powers Ave
- 4507 Katherine St
- Vacant Clippert St
- 4913 Campbell St
- 5614 Katherine St
- 4644 Gertrude St
- 4420 Katherine St
- 5015 Lincoln Blvd
- 4401 Katherine St
- 4665 Lincoln Blvd
- 5656 Monroe St
- 4459 Mckinley St
- 4442 Mckinley St
- 22453 Pardee Ct
- 4008 Katherine St
- 4028 Clippert St
- 000 Hanover St
- 4935 Katherine St
- 4951 Katherine St
- 4927 Katherine St
- 4959 Katherine St
- 4911 Katherine St
- 4944 Dudley St
- 4952 Dudley St
- 4964 Dudley St
- 4928 Dudley St
- 4967 Katherine St
- 4975 Katherine St
- 5112 Dudley St
- 4942 Katherine St
- 4920 Dudley St
- 4950 Katherine St
- 4934 Katherine St
- 4958 Katherine St
- 4926 Katherine St
- 5120 Dudley St
- 4966 Katherine St