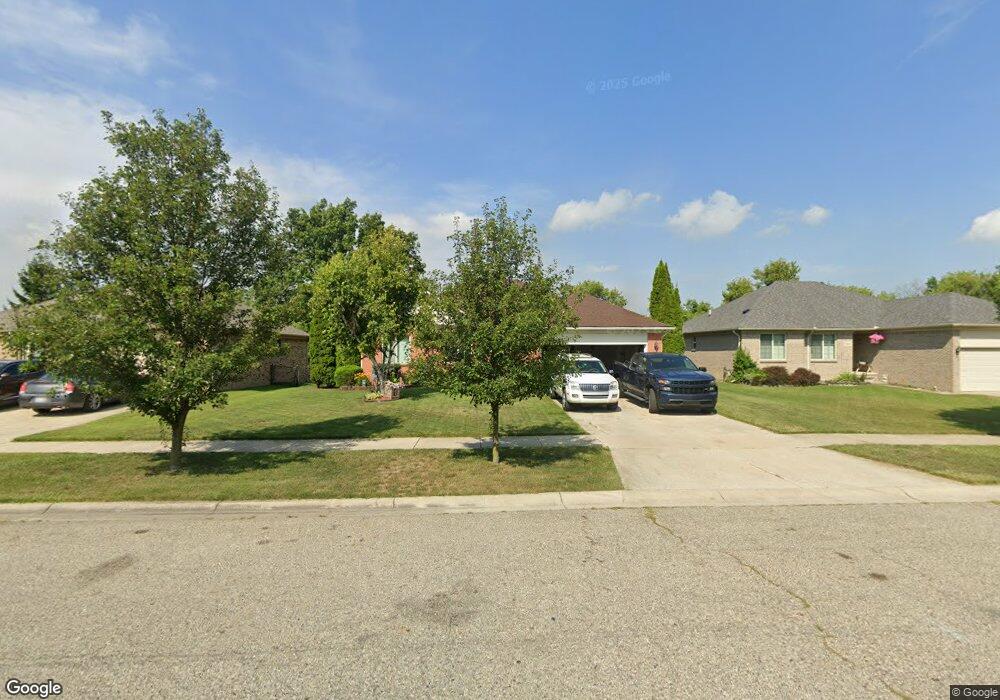
49435 Fossee Rd Chesterfield, MI 48047
Estimated Value: $346,639 - $386,000
3
Beds
2
Baths
1,650
Sq Ft
$221/Sq Ft
Est. Value
About This Home
This home is located at 49435 Fossee Rd, Chesterfield, MI 48047 and is currently estimated at $364,910, approximately $221 per square foot. 49435 Fossee Rd is a home located in Macomb County with nearby schools including Green Elementary School, L'Anse Creuse Middle School - North, and L'Anse Creuse High School - North.
Ownership History
Date
Name
Owned For
Owner Type
Purchase Details
Closed on
May 11, 2009
Sold by
Mortgage Electronic Registration Systems
Bought by
Us Bank National Association
Current Estimated Value
Purchase Details
Closed on
May 8, 2009
Sold by
Drake Marc and Drake Heather
Bought by
Mortgage Electronic Registration Systems
Purchase Details
Closed on
Sep 30, 2005
Sold by
Dragoi Dragos and Dragoi Rodica
Bought by
Drake Marc
Purchase Details
Closed on
Nov 9, 2000
Sold by
Castle Rock Homes Inc
Bought by
Dragoi Dragos
Home Financials for this Owner
Home Financials are based on the most recent Mortgage that was taken out on this home.
Original Mortgage
$157,500
Interest Rate
7.86%
Create a Home Valuation Report for This Property
The Home Valuation Report is an in-depth analysis detailing your home's value as well as a comparison with similar homes in the area
Home Values in the Area
Average Home Value in this Area
Purchase History
| Date | Buyer | Sale Price | Title Company |
|---|---|---|---|
| Us Bank National Association | -- | None Available | |
| Mortgage Electronic Registration Systems | $59,724 | None Available | |
| Drake Marc | $219,200 | Metropolitan Title Company | |
| Dragoi Dragos | $167,900 | -- |
Source: Public Records
Mortgage History
| Date | Status | Borrower | Loan Amount |
|---|---|---|---|
| Previous Owner | Dragoi Dragos | $157,500 |
Source: Public Records
Tax History Compared to Growth
Tax History
| Year | Tax Paid | Tax Assessment Tax Assessment Total Assessment is a certain percentage of the fair market value that is determined by local assessors to be the total taxable value of land and additions on the property. | Land | Improvement |
|---|---|---|---|---|
| 2025 | $3,541 | $155,100 | $0 | $0 |
| 2024 | $2,417 | $147,100 | $0 | $0 |
| 2023 | $2,292 | $131,700 | $0 | $0 |
| 2022 | $3,200 | $128,300 | $0 | $0 |
| 2021 | $3,112 | $124,500 | $0 | $0 |
| 2020 | $2,104 | $118,300 | $0 | $0 |
| 2019 | $2,869 | $110,900 | $0 | $0 |
| 2018 | $2,793 | $109,900 | $15,500 | $94,400 |
| 2017 | $2,754 | $101,550 | $15,450 | $86,100 |
| 2016 | $2,750 | $101,550 | $0 | $0 |
| 2015 | $947 | $94,000 | $0 | $0 |
| 2014 | $947 | $84,750 | $15,450 | $69,300 |
| 2012 | -- | $0 | $0 | $0 |
Source: Public Records
Map
Nearby Homes
- 48749 Smokey Glen Ct
- 27530 Cedar Glen Dr Unit 3
- 48117 Cotton Creek Blvd
- 47479 Lizabeth Dr
- 26805 Mapleridge Dr
- 48323 Whittington Dr
- 48832 Birmingham Dr
- 28715 Portsmouth Ct Unit 32
- 27651 Maryjane Ln
- 28772 Wales Dr
- 48713 Chelmsford Ct Unit 127
- 27633 Maryjane Ln
- 28734 Yarmouth Ct Unit 18
- 49050 Fuller Rd
- 47608 Ramblewood Dr
- 26607 Birchcrest Dr
- 27125 Telstar St
- 26430 Sanajo Ct Unit 20
- 49520 Gratiot Ave
- 26384 Mapleridge Dr
- 49431 Fossee Rd
- 49439 Fossee Rd
- 49427 Fossee
- 49443 Fossee Rd
- 28296 Katie Rd
- 49423 Fossee Rd
- 49447 Fossee Rd
- 28297 Katie Rd
- 28300 Katie Rd
- 49419 Fossee Rd
- 27087 Graham Dr
- 28304 Katie Rd
- 27091 Graham Dr
- 28305 Katie Rd
- 49415 Fossee Rd
- 27095 Graham Dr
- 28308 Katie Rd
- 28309 Katie Rd
- 27082 Graham Dr
- 27099 Graham Dr