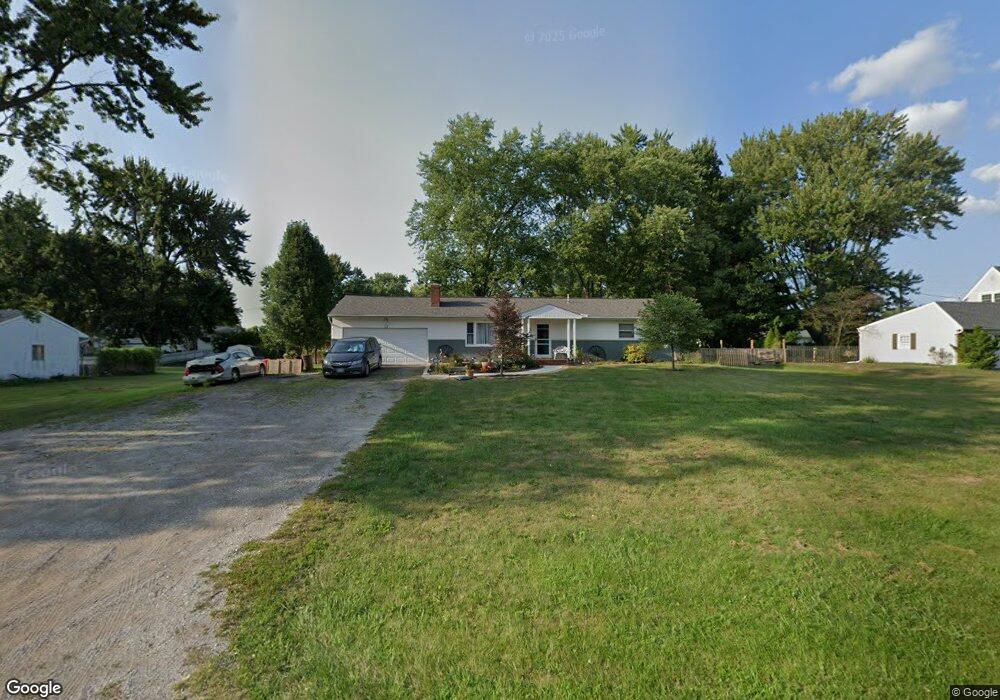
4944 Hayes Rd Groveport, OH 43125
Estimated Value: $278,411 - $328,000
2
Beds
2
Baths
1,222
Sq Ft
$250/Sq Ft
Est. Value
About This Home
This home is located at 4944 Hayes Rd, Groveport, OH 43125 and is currently estimated at $305,603, approximately $250 per square foot. 4944 Hayes Rd is a home located in Franklin County with nearby schools including Groveport Madison High School and Groveport Community School.
Ownership History
Date
Name
Owned For
Owner Type
Purchase Details
Closed on
Mar 8, 2017
Sold by
Boling Daphne C
Bought by
Boling Thomas and Boling Christopher
Current Estimated Value
Purchase Details
Closed on
Aug 18, 2014
Sold by
Boling Guy G and Boling Daphne
Bought by
Boling Guy G and Boling Daphne
Purchase Details
Closed on
Apr 24, 1968
Bought by
Boling Guy E and Boling Ethel M
Create a Home Valuation Report for This Property
The Home Valuation Report is an in-depth analysis detailing your home's value as well as a comparison with similar homes in the area
Home Values in the Area
Average Home Value in this Area
Purchase History
| Date | Buyer | Sale Price | Title Company |
|---|---|---|---|
| Boling Thomas | -- | None Available | |
| Boling Guy G | -- | None Available | |
| Boling Guy E | -- | -- |
Source: Public Records
Tax History Compared to Growth
Tax History
| Year | Tax Paid | Tax Assessment Tax Assessment Total Assessment is a certain percentage of the fair market value that is determined by local assessors to be the total taxable value of land and additions on the property. | Land | Improvement |
|---|---|---|---|---|
| 2024 | $3,415 | $80,640 | $22,330 | $58,310 |
| 2023 | $3,414 | $80,640 | $22,330 | $58,310 |
| 2022 | $2,169 | $44,870 | $7,490 | $37,380 |
| 2021 | $2,178 | $44,870 | $7,490 | $37,380 |
| 2020 | $2,395 | $44,870 | $7,490 | $37,380 |
| 2019 | $2,653 | $37,770 | $6,270 | $31,500 |
| 2018 | $2,836 | $37,770 | $6,270 | $31,500 |
| 2017 | $2,795 | $37,770 | $6,270 | $31,500 |
| 2016 | $2,978 | $38,160 | $9,420 | $28,740 |
| 2015 | $3,004 | $38,160 | $9,420 | $28,740 |
| 2014 | $2,129 | $38,160 | $9,420 | $28,740 |
| 2013 | $906 | $38,150 | $9,415 | $28,735 |
Source: Public Records
Map
Nearby Homes
- 7616 Richardson Rd
- 5273 Hayes Rd
- 7908 Richardson Rd
- 7495 Lithopolis Rd
- 6065 Wilson Dr
- 7474 Groveport Rd
- 525 Gender Rd
- 6172 Eagle Dr Unit 6172
- 7170 Seymour Ct
- 6216 Meriden Ct
- 6185 Dietz Dr
- 963 Groveport Rd
- 6430 Rossmore Ln
- 287 College St
- 6470 Fox Hill Dr
- 7191 Rosemount Way
- 135 Front St
- Ironwood Plan at Edgewood Farms
- Aspen II Plan at Edgewood Farms
- Bradford Plan at Edgewood Farms
- 4960 Hayes Rd
- 4928 Hayes Rd
- 4959 Johnanne Dr
- 4939 Johnanne Dr
- 4972 Hayes Rd
- 4939 Hayes Rd
- 4929 Hayes Rd
- 4967 Hayes Rd
- 4904 Hayes Rd
- 4986 Hayes Rd
- 4915 Hayes Rd
- 4999 Johnanne Dr
- 4919 Johnanne Dr
- 4962 Johnanne Dr
- 4982 Johnanne Dr
- 4940 Johnanne Dr
- 4903 Hayes Rd
- 4979 Hayes Rd
- 4888 Hayes Rd
- 5000 Hayes Rd