Estimated Value: $577,000 - $671,000
4
Beds
1
Bath
2,133
Sq Ft
$291/Sq Ft
Est. Value
About This Home
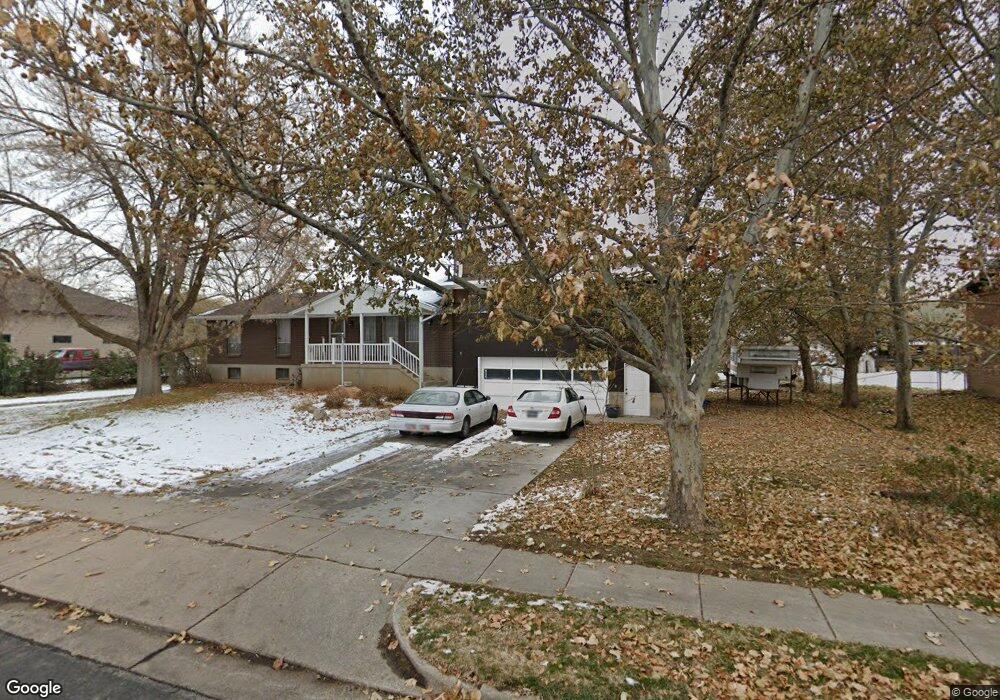
This home is located at 4944 S 3100 W, Roy, UT 84067 and is currently estimated at $620,904, approximately $291 per square foot. 4944 S 3100 W is a home located in Weber County with nearby schools including Midland School, Sand Ridge Junior High School, and Roy High School.
Ownership History
Date
Name
Owned For
Owner Type
Purchase Details
Closed on
Apr 20, 2011
Sold by
The Family Trust Of Bruce & Julie Peters
Bought by
The Family Trust Of Kenneth J & Marilyn
Current Estimated Value
Purchase Details
Closed on
Jan 26, 2009
Sold by
Russell Marilyn and Russell Kenneth
Bought by
Russell Kenneth J and Russell Marilyn R
Home Financials for this Owner
Home Financials are based on the most recent Mortgage that was taken out on this home.
Original Mortgage
$103,500
Interest Rate
5.14%
Mortgage Type
New Conventional
Purchase Details
Closed on
Jun 19, 2002
Sold by
Russell Kenneth J and Russell Marilyn R
Bought by
Russell Kenneth and Russell Marilyn
Home Financials for this Owner
Home Financials are based on the most recent Mortgage that was taken out on this home.
Original Mortgage
$120,000
Interest Rate
6.74%
Create a Home Valuation Report for This Property
The Home Valuation Report is an in-depth analysis detailing your home's value as well as a comparison with similar homes in the area
Home Values in the Area
Average Home Value in this Area
Purchase History
| Date | Buyer | Sale Price | Title Company |
|---|---|---|---|
| The Family Trust Of Kenneth J & Marilyn | -- | None Available | |
| Russell Kenneth J | -- | Lincoln Title Ins Agency | |
| Russell Marilyn | -- | Lincoln Title Ins Agency | |
| Russell Kenneth | -- | Associated Title |
Source: Public Records
Mortgage History
| Date | Status | Borrower | Loan Amount |
|---|---|---|---|
| Previous Owner | Russell Marilyn | $103,500 | |
| Previous Owner | Russell Kenneth | $120,000 |
Source: Public Records
Tax History
| Year | Tax Paid | Tax Assessment Tax Assessment Total Assessment is a certain percentage of the fair market value that is determined by local assessors to be the total taxable value of land and additions on the property. | Land | Improvement |
|---|---|---|---|---|
| 2025 | $4,456 | $642,602 | $236,987 | $405,615 |
| 2024 | $4,263 | $360,763 | $146,250 | $214,513 |
| 2023 | $4,063 | $343,067 | $101,949 | $241,118 |
| 2022 | $4,508 | $381,150 | $88,569 | $292,581 |
| 2021 | $3,333 | $450,001 | $120,420 | $329,581 |
| 2020 | $2,967 | $368,000 | $120,420 | $247,580 |
| 2019 | $2,931 | $346,000 | $87,543 | $258,457 |
| 2018 | $2,641 | $315,000 | $87,543 | $227,457 |
| 2017 | $2,484 | $259,000 | $87,543 | $171,457 |
| 2016 | $2,309 | $136,286 | $47,738 | $88,548 |
| 2015 | $2,227 | $136,286 | $47,738 | $88,548 |
| 2014 | $2,230 | $136,286 | $47,738 | $88,548 |
Source: Public Records
Map
Nearby Homes
- 5009 S 2925 W
- 4793 S 3025 W
- 4891 S 2875 W
- 5141 S 2975 W
- 5155 S 3200 W
- 3022 W 4750 S
- 5063 S 2825 W
- 2817 W 5000 S
- 2953 W 4650 S
- 5304 S 3100 W
- 5321 S 3100 W
- 4732 S West Park Dr
- 3443 W 5200 S Unit 2&3
- 3509 W 4835 S Unit 26
- 3517 W 4835 S Unit 27
- 4510 Stone Creek Rd Unit F
- 2581 W 5000 S
- 3405 W 4525 S
- 4491 Haven Creek Rd Unit A
- 5125 S 2600 W
Your Personal Tour Guide
Ask me questions while you tour the home.