4945 N Cherry Creek Columbus, OH 43228
Cherry Creek NeighborhoodEstimated Value: $236,000 - $308,798
2
Beds
2
Baths
1,872
Sq Ft
$148/Sq Ft
Est. Value
About This Home
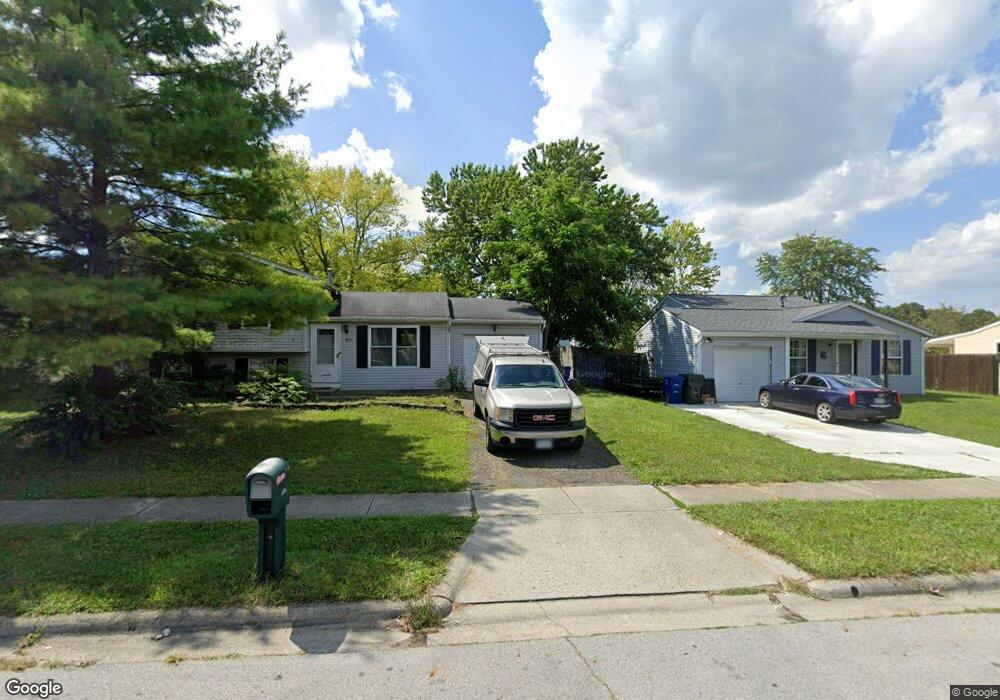
This home is located at 4945 N Cherry Creek, Columbus, OH 43228 and is currently estimated at $276,450, approximately $147 per square foot. 4945 N Cherry Creek is a home located in Franklin County with nearby schools including Stiles Elementary School, Holt Crossing Intermediate School, and Pleasant View Middle School.
Ownership History
Date
Name
Owned For
Owner Type
Purchase Details
Closed on
Jun 22, 2012
Sold by
Wells Fargo Delaware Trust Company Na
Bought by
Meleshchuk Viktor and Meleshchuk Vera
Current Estimated Value
Purchase Details
Closed on
Jan 5, 2012
Sold by
Rimer Cinda L
Bought by
Wells Fargo Delaware Trust Co Na
Purchase Details
Closed on
Dec 13, 2000
Sold by
Mcdole Mildred E
Bought by
Rimer Cinda L
Home Financials for this Owner
Home Financials are based on the most recent Mortgage that was taken out on this home.
Original Mortgage
$72,800
Interest Rate
7.77%
Purchase Details
Closed on
Aug 23, 2000
Sold by
Mcdole Mildred E
Bought by
Mcdole Mildred E and Rimer Cinda
Purchase Details
Closed on
Aug 4, 2000
Sold by
Estate Of Clarence E Mcdale
Bought by
Mcdale Mildred E
Purchase Details
Closed on
Aug 2, 1974
Bought by
Mcdole Clarence E
Create a Home Valuation Report for This Property
The Home Valuation Report is an in-depth analysis detailing your home's value as well as a comparison with similar homes in the area
Home Values in the Area
Average Home Value in this Area
Purchase History
| Date | Buyer | Sale Price | Title Company |
|---|---|---|---|
| Meleshchuk Viktor | -- | Intitle Agency Inc | |
| Wells Fargo Delaware Trust Co Na | $56,300 | None Available | |
| Rimer Cinda L | $90,500 | -- | |
| Mcdole Mildred E | $51,900 | Express Title Services Of Oh | |
| Mcdale Mildred E | -- | -- | |
| Mcdole Clarence E | -- | -- |
Source: Public Records
Mortgage History
| Date | Status | Borrower | Loan Amount |
|---|---|---|---|
| Previous Owner | Rimer Cinda L | $72,800 |
Source: Public Records
Tax History Compared to Growth
Tax History
| Year | Tax Paid | Tax Assessment Tax Assessment Total Assessment is a certain percentage of the fair market value that is determined by local assessors to be the total taxable value of land and additions on the property. | Land | Improvement |
|---|---|---|---|---|
| 2024 | $3,464 | $92,620 | $18,170 | $74,450 |
| 2023 | $3,404 | $92,610 | $18,165 | $74,445 |
| 2022 | $2,675 | $53,410 | $7,210 | $46,200 |
| 2021 | $2,728 | $53,410 | $7,210 | $46,200 |
| 2020 | $2,714 | $53,410 | $7,210 | $46,200 |
| 2019 | $2,565 | $44,520 | $6,020 | $38,500 |
| 2018 | $1,277 | $44,520 | $6,020 | $38,500 |
| 2017 | $2,545 | $44,520 | $6,020 | $38,500 |
| 2016 | $2,390 | $38,400 | $6,020 | $32,380 |
| 2015 | $1,195 | $38,400 | $6,020 | $32,380 |
| 2014 | $2,392 | $38,400 | $6,020 | $32,380 |
| 2013 | $1,249 | $40,425 | $6,335 | $34,090 |
Source: Public Records
Map
Nearby Homes
- 5006 Old Tree Ave
- 4950 Cherry Creek Pkwy S
- 4789 Dolan Place
- 435 Redmond Rd
- 4848 Deephollow Dr
- 4778 Hafey Ave
- 4763 Hafey Ave
- 429 Postle Blvd
- 354 Fernhill Ave
- 4715 Sullivant Ave Unit 46
- 840 Cherry Bud Dr
- 488 Lombard Rd
- 264 Woodlawn Ave
- 299 Lombard Rd
- 542 Clairbrook Ave Unit 11
- 805 Pipers Ln
- 491 Clairbrook Ave Unit 3
- 579 Simbury St Unit B9
- 477 Clairbrook Ave
- 515 Clairbrook Ave
- 4937 Old Tree Ave
- 4943 Old Tree Ave
- 628 Oak Brook Place
- 620 Oak Brook Place
- 640 Cherry Ridge Rd
- 642 Cherry Ridge Rd
- 4928-4934 N Cherry Creek
- 4928 Cherry Creek Pkwy N Unit 934
- 631 Cherry Glen Rd Unit 23B
- 631 Cherry Glen Rd Unit B
- 633 Cherry Glen Rd
- 644 Cherry Ridge Rd
- 646 Cherry Ridge Rd Unit 24A
- 4951 Old Tree Ave
- 637 Cherry Glen Rd Unit 23A
- 637 Cherry Glen Rd Unit A
- 614 Oak Brook Place
- 635 Cherry Glen Rd
- 4926 Old Tree Ave
- 650 Cherry Ridge Rd Unit 25C