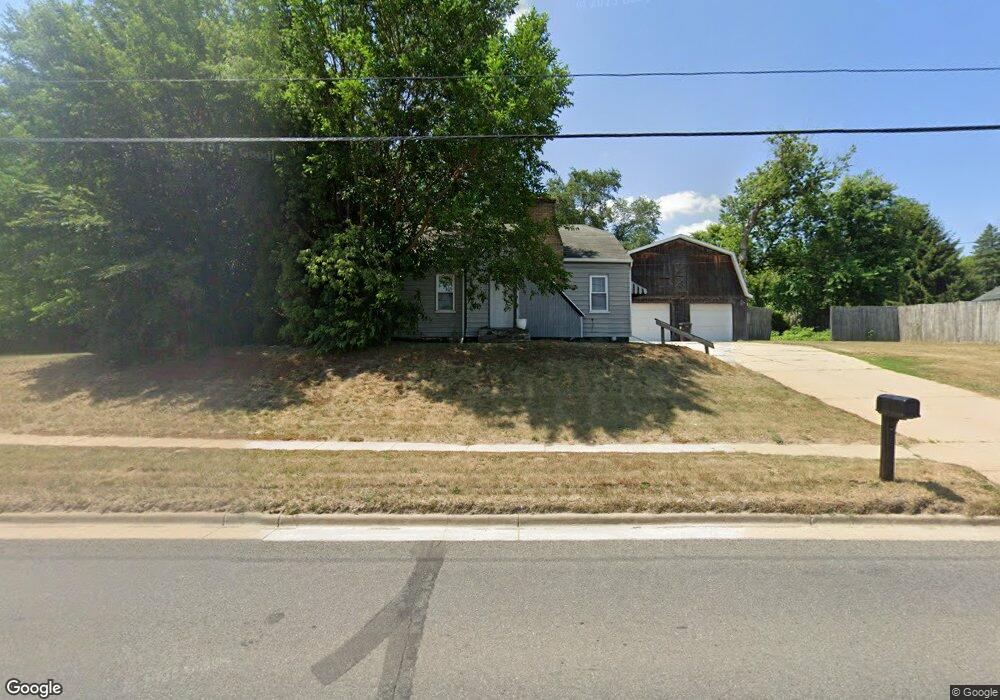
4945 West River Dr NE Comstock Park, MI 49321
Estimated Value: $237,000 - $278,000
--
Bed
--
Bath
--
Sq Ft
0.46
Acres
About This Home
This home is located at 4945 West River Dr NE, Comstock Park, MI 49321 and is currently estimated at $257,057. 4945 West River Dr NE is a home located in Kent County with nearby schools including Pine Island Elementary School, Stoney Creek Elementary School, and Mill Creek Middle School.
Ownership History
Date
Name
Owned For
Owner Type
Purchase Details
Closed on
Mar 25, 2009
Sold by
Thompson Peter B and Thompson Marcia L
Bought by
Bank Of New York
Current Estimated Value
Home Financials for this Owner
Home Financials are based on the most recent Mortgage that was taken out on this home.
Original Mortgage
$56,949
Outstanding Balance
$36,346
Interest Rate
5.2%
Mortgage Type
FHA
Estimated Equity
$220,711
Purchase Details
Closed on
Mar 13, 2009
Sold by
4945 West River Land Trust
Bought by
Brown David T
Home Financials for this Owner
Home Financials are based on the most recent Mortgage that was taken out on this home.
Original Mortgage
$56,949
Outstanding Balance
$36,346
Interest Rate
5.2%
Mortgage Type
FHA
Estimated Equity
$220,711
Purchase Details
Closed on
Nov 12, 2008
Sold by
Thompson Peter B and Thompson Marcia L
Bought by
Countrywide Home Loans Inc
Purchase Details
Closed on
Sep 28, 1998
Sold by
Skelding Sue
Bought by
Thompson Peter B and Brown David T
Purchase Details
Closed on
May 30, 1986
Create a Home Valuation Report for This Property
The Home Valuation Report is an in-depth analysis detailing your home's value as well as a comparison with similar homes in the area
Home Values in the Area
Average Home Value in this Area
Purchase History
| Date | Buyer | Sale Price | Title Company |
|---|---|---|---|
| Bank Of New York | $37,400 | None Available | |
| Brown David T | -- | Triunion Title | |
| Countrywide Home Loans Inc | $61,200 | None Available | |
| Thompson Peter B | $81,000 | -- | |
| -- | $43,500 | -- |
Source: Public Records
Mortgage History
| Date | Status | Borrower | Loan Amount |
|---|---|---|---|
| Open | Brown David T | $56,949 |
Source: Public Records
Tax History Compared to Growth
Tax History
| Year | Tax Paid | Tax Assessment Tax Assessment Total Assessment is a certain percentage of the fair market value that is determined by local assessors to be the total taxable value of land and additions on the property. | Land | Improvement |
|---|---|---|---|---|
| 2025 | $1,639 | $111,600 | $0 | $0 |
| 2024 | $1,639 | $104,700 | $0 | $0 |
| 2023 | $1,566 | $99,300 | $0 | $0 |
| 2022 | $2,605 | $78,600 | $0 | $0 |
| 2021 | $1,866 | $74,800 | $0 | $0 |
| 2020 | $1,438 | $65,600 | $0 | $0 |
| 2019 | $1,821 | $51,500 | $0 | $0 |
| 2018 | $2,472 | $48,400 | $0 | $0 |
| 2017 | $2,110 | $65,600 | $0 | $0 |
| 2016 | $2,043 | $63,300 | $0 | $0 |
| 2015 | $2,040 | $63,300 | $0 | $0 |
| 2013 | -- | $59,300 | $0 | $0 |
Source: Public Records
Map
Nearby Homes
- 5090 Wakefield Ave NE
- 578 Melissa Ct NE
- 980 River Rock Dr NE
- 122 Blue Violet Ln NE Unit 99
- 5555 Skyway Dr NE
- 5621 Pine Island Dr NE
- 33 Star Gazer Ln NE
- VL Par C Buth Dr NE
- VL Par B Buth Dr NE
- VL Par D Buth Dr NE
- 446 Windchime Dr
- 3661 Willow Dr NE
- 5819 Grand Oaks Dr NE
- 4005 Filkins Dr NE
- 4893 Stony Creek Ave NW
- 187 Lantern Dr NW
- 5011 Coit Ave NE
- 5856 Hillbrook Ct NE
- 3903 Willow Dr NE
- Wilshire Plan at The Range
- 4945 W River Dr NE
- 4963 W River Dr NE
- 4963 West River Dr NE
- 4963 West River Dr NE
- 4935 W River Dr NE
- 4975 W River Dr NE
- 4975 West River Dr NE
- 4927 W River Dr NE
- 4927 West River Dr NE
- 4985 W River Dr NE
- 4985 West River Dr NE
- 4934 West River Dr NE
- 4921 West River Dr NE
- 4921 W River Dr NE
- 4934 W River Dr NE
- 4908 West River Dr NE
- 4907 West River Dr NE
- 4908 W River Dr NE
- 4908 W Dr
- 4930 Pine Island Dr NE