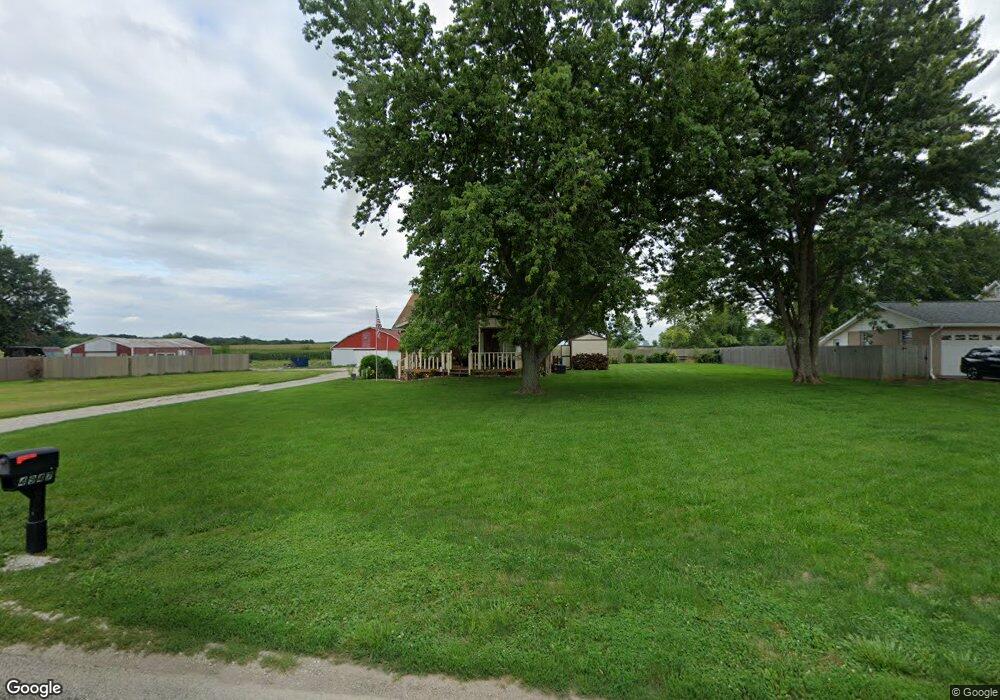
4947 E Boyd Rd Decatur, IL 62521
Estimated Value: $180,000 - $286,000
3
Beds
2
Baths
2,196
Sq Ft
$108/Sq Ft
Est. Value
About This Home
This home is located at 4947 E Boyd Rd, Decatur, IL 62521 and is currently estimated at $237,874, approximately $108 per square foot. 4947 E Boyd Rd is a home located in Macon County with nearby schools including Argenta-Oreana Elementary School, Argenta-Oreana Middle School, and Argenta Oreana High School.
Ownership History
Date
Name
Owned For
Owner Type
Purchase Details
Closed on
Dec 18, 2020
Sold by
Do Thanh Y
Bought by
Mclaughlin David L
Current Estimated Value
Home Financials for this Owner
Home Financials are based on the most recent Mortgage that was taken out on this home.
Original Mortgage
$252,850
Outstanding Balance
$225,112
Interest Rate
2.7%
Mortgage Type
New Conventional
Estimated Equity
$12,762
Purchase Details
Closed on
Feb 5, 2015
Purchase Details
Closed on
Jan 25, 2005
Sold by
Casey Larry K
Bought by
Mclaughlin David L and Do Thanh Y
Home Financials for this Owner
Home Financials are based on the most recent Mortgage that was taken out on this home.
Original Mortgage
$104,550
Interest Rate
5.83%
Mortgage Type
New Conventional
Purchase Details
Closed on
Dec 1, 2004
Home Financials for this Owner
Home Financials are based on the most recent Mortgage that was taken out on this home.
Original Mortgage
$104,550
Interest Rate
5.83%
Mortgage Type
New Conventional
Purchase Details
Closed on
Jan 1, 1995
Create a Home Valuation Report for This Property
The Home Valuation Report is an in-depth analysis detailing your home's value as well as a comparison with similar homes in the area
Purchase History
| Date | Buyer | Sale Price | Title Company |
|---|---|---|---|
| Mclaughlin David L | $132,500 | None Available | |
| -- | -- | -- | |
| Mclaughlin David L | $123,000 | None Available | |
| -- | $123,000 | -- | |
| -- | $99,000 | -- |
Source: Public Records
Mortgage History
| Date | Status | Borrower | Loan Amount |
|---|---|---|---|
| Open | Mclaughlin David L | $252,850 | |
| Previous Owner | Mclaughlin David L | $104,550 |
Source: Public Records
Tax History
| Year | Tax Paid | Tax Assessment Tax Assessment Total Assessment is a certain percentage of the fair market value that is determined by local assessors to be the total taxable value of land and additions on the property. | Land | Improvement |
|---|---|---|---|---|
| 2024 | $3,803 | $55,197 | $13,691 | $41,506 |
| 2023 | $3,600 | $50,335 | $12,651 | $37,684 |
| 2022 | $3,523 | $47,068 | $11,886 | $35,182 |
| 2021 | $3,400 | $43,929 | $11,162 | $32,767 |
| 2020 | $2,813 | $41,916 | $10,439 | $31,477 |
| 2019 | $2,840 | $42,254 | $10,777 | $31,477 |
| 2018 | $2,784 | $41,573 | $9,790 | $31,783 |
| 2017 | $3,327 | $48,309 | $13,335 | $34,974 |
| 2016 | $3,877 | $48,411 | $13,363 | $35,048 |
| 2015 | $3,304 | $48,027 | $13,257 | $34,770 |
| 2014 | $3,195 | $48,027 | $13,257 | $34,770 |
| 2013 | $3,222 | $48,027 | $13,257 | $34,770 |
Source: Public Records
Map
Nearby Homes
- 5527 N Route 48
- 3940 Graces Ln
- 5830 N Route 48
- 5210 E Hammer Place
- 5210 Hammer Place
- 3638 Plover Dr
- 215 W Plains Dr
- 205 Rayjon Dr
- 3541 Plover Dr
- 0 E Condor Dr Unit 6255944
- 0 E Condor Dr Unit 6255943
- 3410 Plover Dr
- 202 W South St
- 23 Tanager Dr
- 2221 E Mound Rd
- 4018 Nottingham Dr
- 2915 N 25th St
- 1686 E Barrington Ave
- 2918 N 22nd St
- 3146 E Garfield Ave
- 4979 E Boyd Rd
- 4895 E Boyd Rd
- 4845 E Boyd Rd
- 4997 E Boyd Rd
- 4875 E Boyd Rd
- 4749 E Boyd Rd
- 4887 E Boyd Rd
- 4617 E Boyd Rd
- 5267 E Boyd Rd
- 5295 E Boyd Rd
- 4575 Forest Pkwy
- 4940 Garver Church Rd
- 4555 Forest Pkwy
- 4555 Forest Pkwy
- 4513 Forest Pkwy
- 4735 Forest Pkwy
- 4580 Forest Pkwy
- 4493 Forest Pkwy
- 4465 Forest Pkwy
- 4526 Forest Pkwy
Your Personal Tour Guide
Ask me questions while you tour the home.