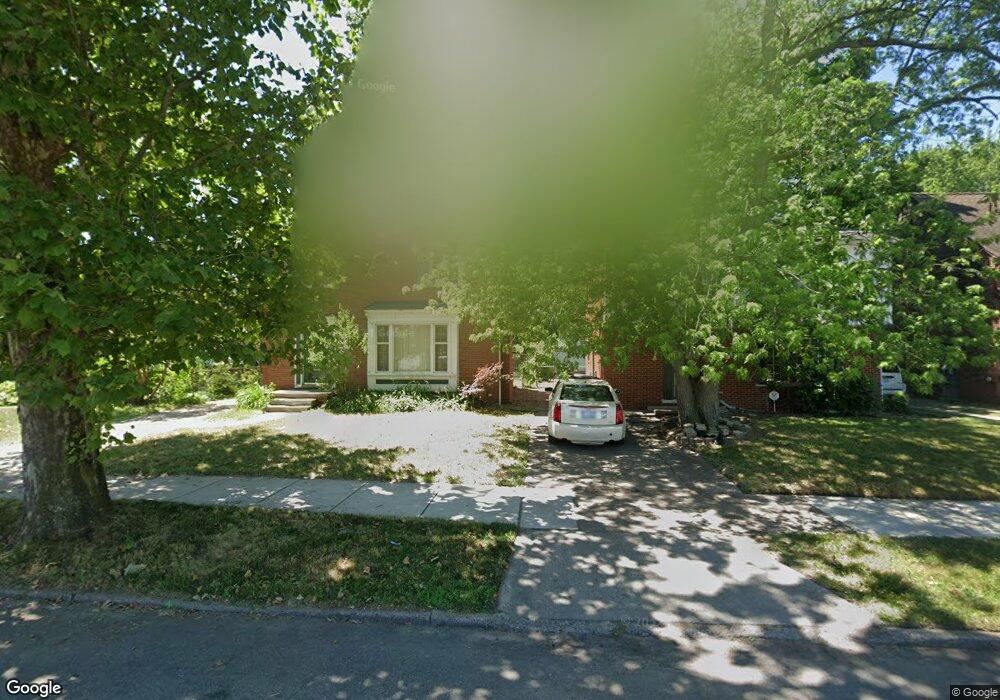
4947 Hillcrest St Grosse Pointe, MI 48236
Cornerstone Village NeighborhoodEstimated Value: $167,000 - $219,000
3
Beds
2
Baths
1,644
Sq Ft
$117/Sq Ft
Est. Value
About This Home
This home is located at 4947 Hillcrest St, Grosse Pointe, MI 48236 and is currently estimated at $192,794, approximately $117 per square foot. 4947 Hillcrest St is a home located in Wayne County with nearby schools including Marquette Elementary-Middle School, Edward 'Duke' Ellington Conservatory of Music and Art, and Charles L. Spain Elementary-Middle School.
Ownership History
Date
Name
Owned For
Owner Type
Purchase Details
Closed on
Sep 18, 2009
Sold by
Sugick Jon
Bought by
Kimbrough Sugick Jessie K
Current Estimated Value
Home Financials for this Owner
Home Financials are based on the most recent Mortgage that was taken out on this home.
Original Mortgage
$163,805
Outstanding Balance
$108,157
Interest Rate
5.38%
Mortgage Type
FHA
Estimated Equity
$84,637
Purchase Details
Closed on
Oct 4, 2006
Sold by
Sugick Jon J and Kimborough Sugick Jessie K
Bought by
Kimborough Sugick Jessie K
Purchase Details
Closed on
Nov 1, 2002
Sold by
Boyd Edna M
Bought by
Sugick Jessie K Kimbrough
Create a Home Valuation Report for This Property
The Home Valuation Report is an in-depth analysis detailing your home's value as well as a comparison with similar homes in the area
Home Values in the Area
Average Home Value in this Area
Purchase History
| Date | Buyer | Sale Price | Title Company |
|---|---|---|---|
| Kimbrough Sugick Jessie K | -- | Title Connect Llc | |
| Kimborough Sugick Jessie K | -- | Wolverine Title & Escrow Age | |
| Sugick Jessie K Kimbrough | $146,000 | -- |
Source: Public Records
Mortgage History
| Date | Status | Borrower | Loan Amount |
|---|---|---|---|
| Open | Kimbrough Sugick Jessie K | $163,805 |
Source: Public Records
Tax History
| Year | Tax Paid | Tax Assessment Tax Assessment Total Assessment is a certain percentage of the fair market value that is determined by local assessors to be the total taxable value of land and additions on the property. | Land | Improvement |
|---|---|---|---|---|
| 2025 | $1,666 | $66,400 | $0 | $0 |
| 2024 | $1,689 | $57,900 | $0 | $0 |
| 2023 | $1,639 | $43,000 | $0 | $0 |
| 2022 | $1,805 | $40,600 | $0 | $0 |
| 2021 | $1,757 | $31,700 | $0 | $0 |
| 2020 | $1,737 | $28,400 | $0 | $0 |
| 2019 | $1,709 | $24,400 | $0 | $0 |
| 2018 | $1,440 | $20,400 | $0 | $0 |
| 2017 | $395 | $20,800 | $0 | $0 |
| 2016 | $1,875 | $27,200 | $0 | $0 |
| 2015 | $2,720 | $27,200 | $0 | $0 |
| 2013 | $3,873 | $38,729 | $0 | $0 |
| 2010 | -- | $56,781 | $1,268 | $55,513 |
Source: Public Records
Map
Nearby Homes
- 5231 Lannoo St
- 5228 Hillcrest St
- 22200 Moross Rd
- 419 Maison Rd
- 5047 Anatole St
- 407 Kerby Rd
- 21970 Moross Rd
- 373 Ridgemont Rd
- 410 Calvin Ave
- 21820 Moross Rd
- 21806 Moross Rd
- 21800 Moross Rd
- 351 Ridgemont Rd
- 21756 Moross Rd
- 19299 Raymond St
- 21718 Moross Rd
- 412 Manor St
- 5210 Farmbrook St
- 5570 Farmbrook St
- 5754 Farmbrook St
- 4957 Hillcrest St
- 4941 Hillcrest St
- 4965 Hillcrest St
- 4971 Hillcrest St
- 4964 Lannoo St
- 4956 Lannoo St
- 4972 Lannoo St
- 4972 Lannoo St
- 4948 Lannoo St
- 4981 Hillcrest St
- 19001 Mack Ave
- 4980 Lannoo St
- 4936 Hillcrest St
- 4944 Hillcrest St
- 4988 Lannoo St
- 4988 Lannoo St
- 4952 Hillcrest St
- 4987 Hillcrest St
- 4962 Hillcrest St
- 4962 Hillcrest St
Your Personal Tour Guide
Ask me questions while you tour the home.